Chapter 6 Background Settings (Offset Tab)
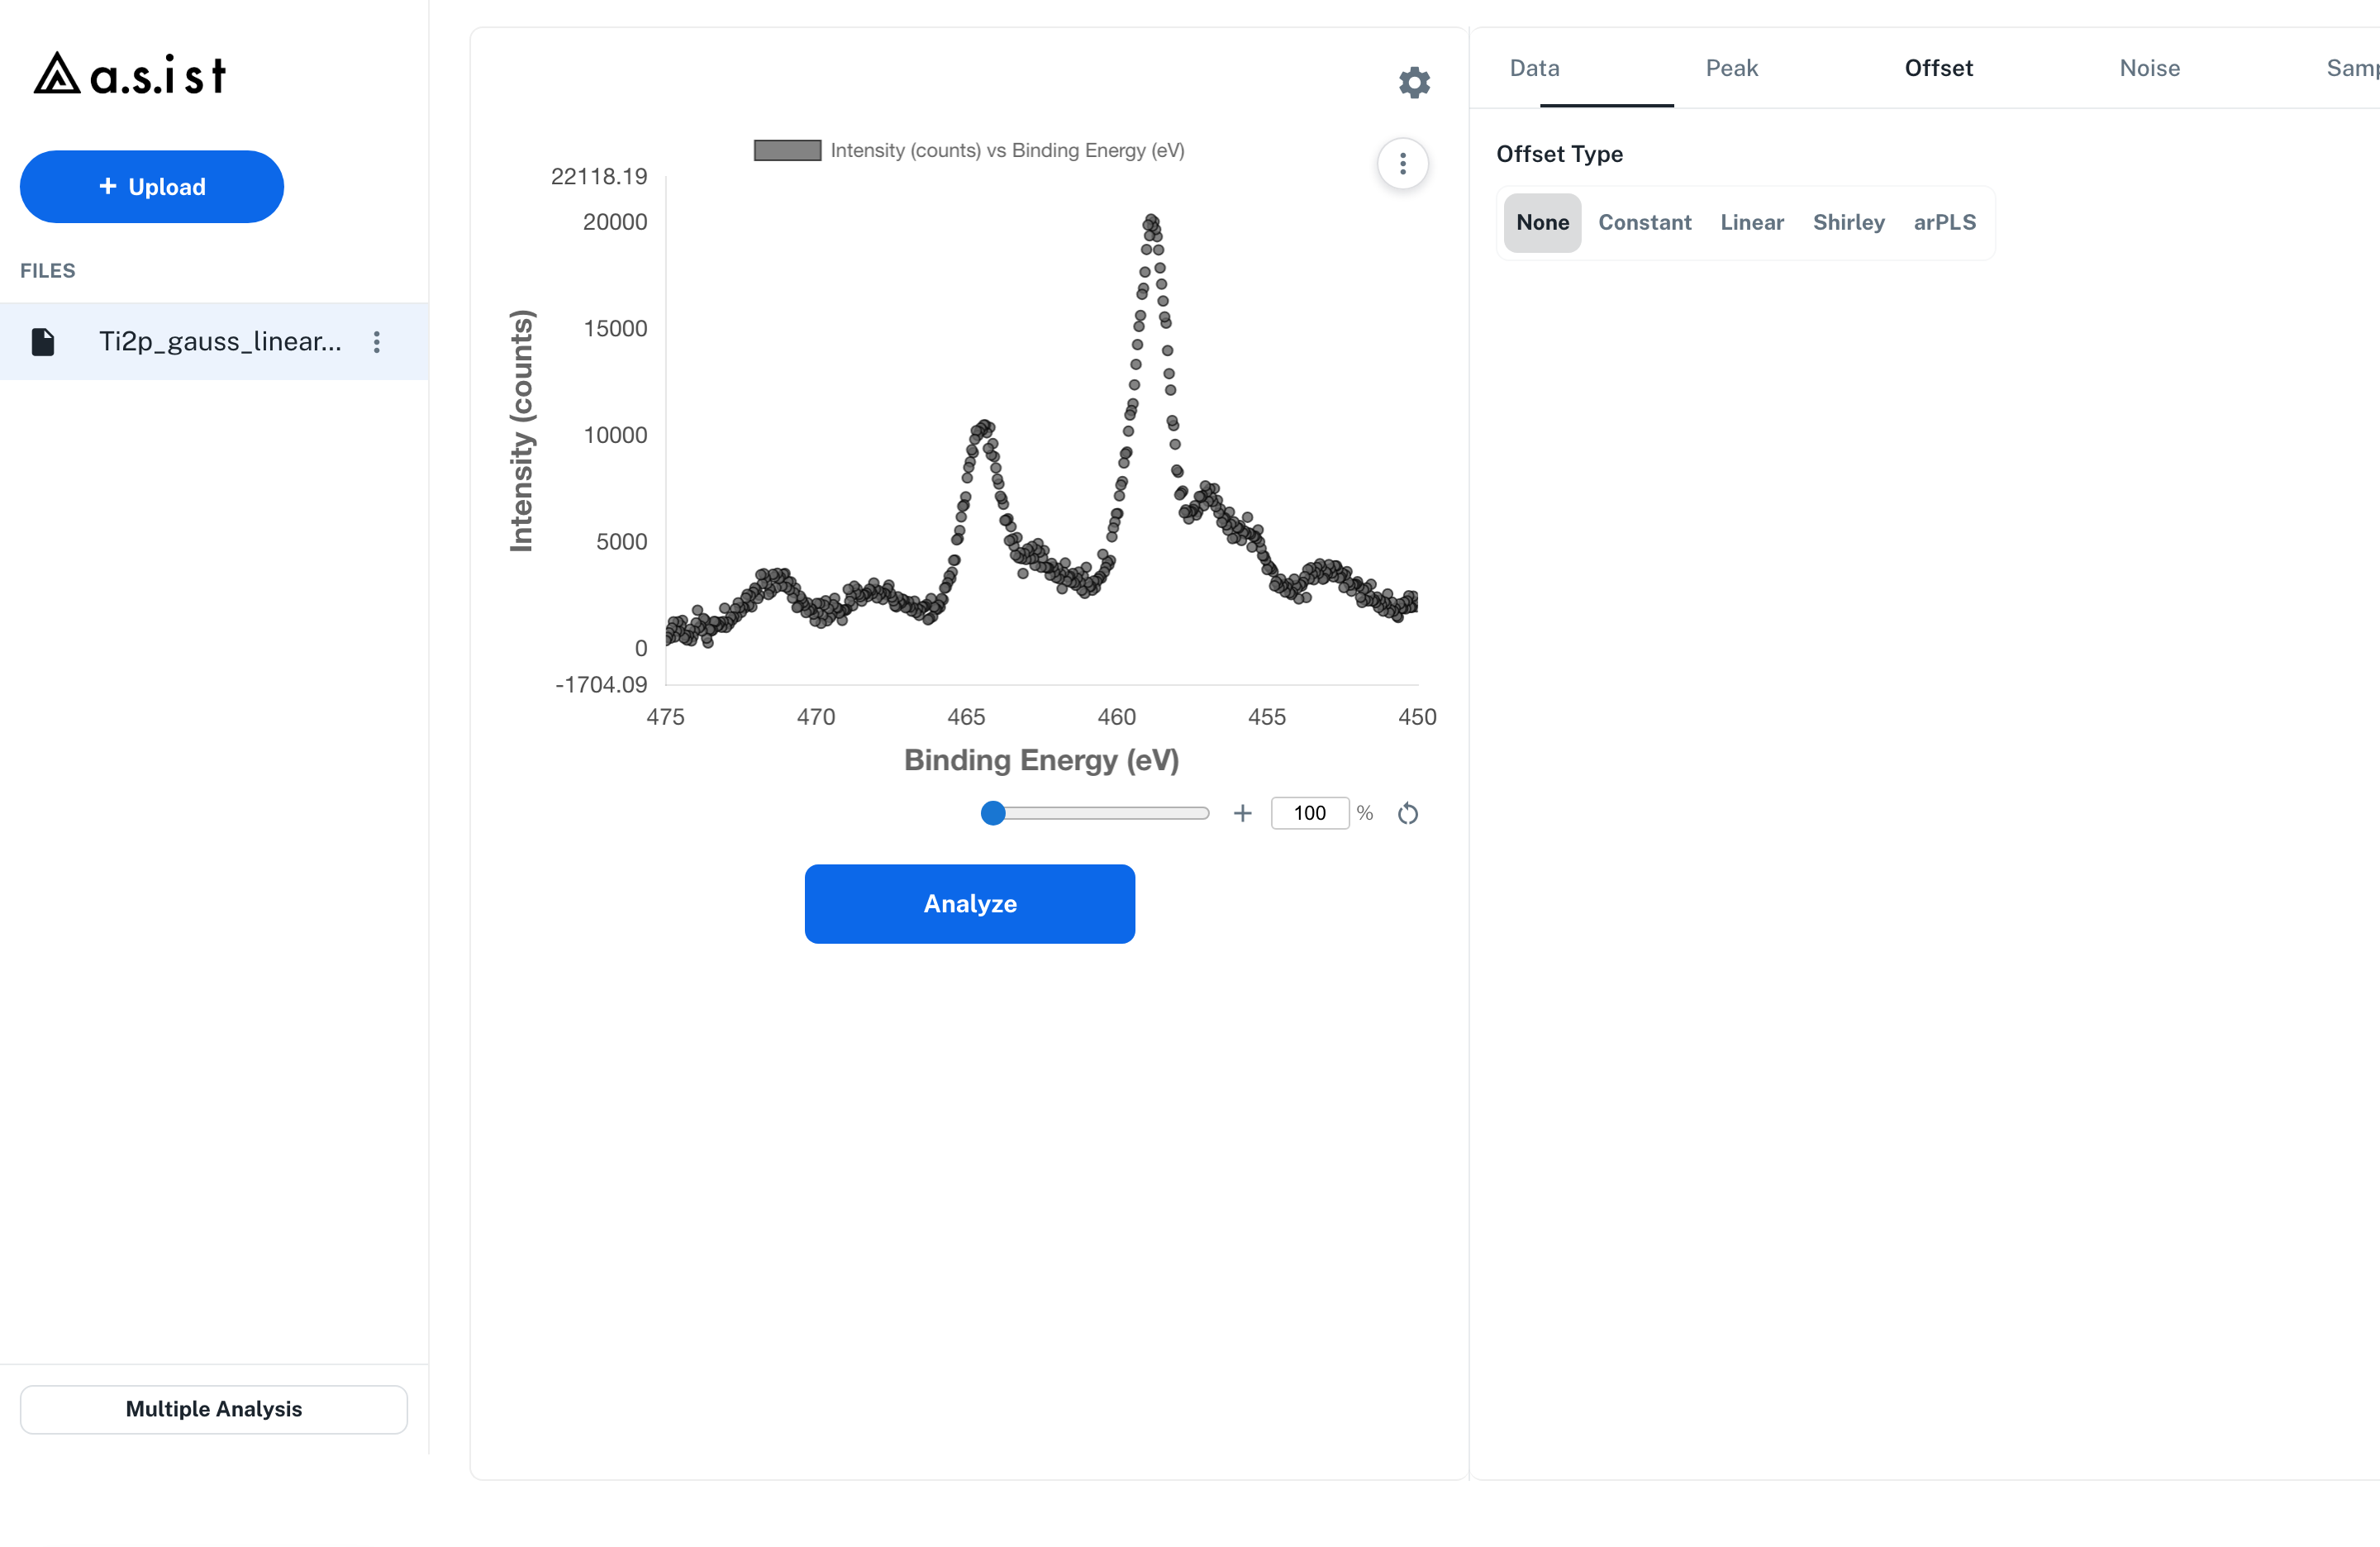
In the Offset tab, you configure the type and range of the background to be subtracted from the spectrum.
6.1 Selecting the Offset Type
In the Offset Type section, select one of the following.
| Type | Equation / Description |
|---|---|
| None | No background is subtracted (the spectrum itself is fitted) |
| Constant | \(b(x) = c\) — a constant background |
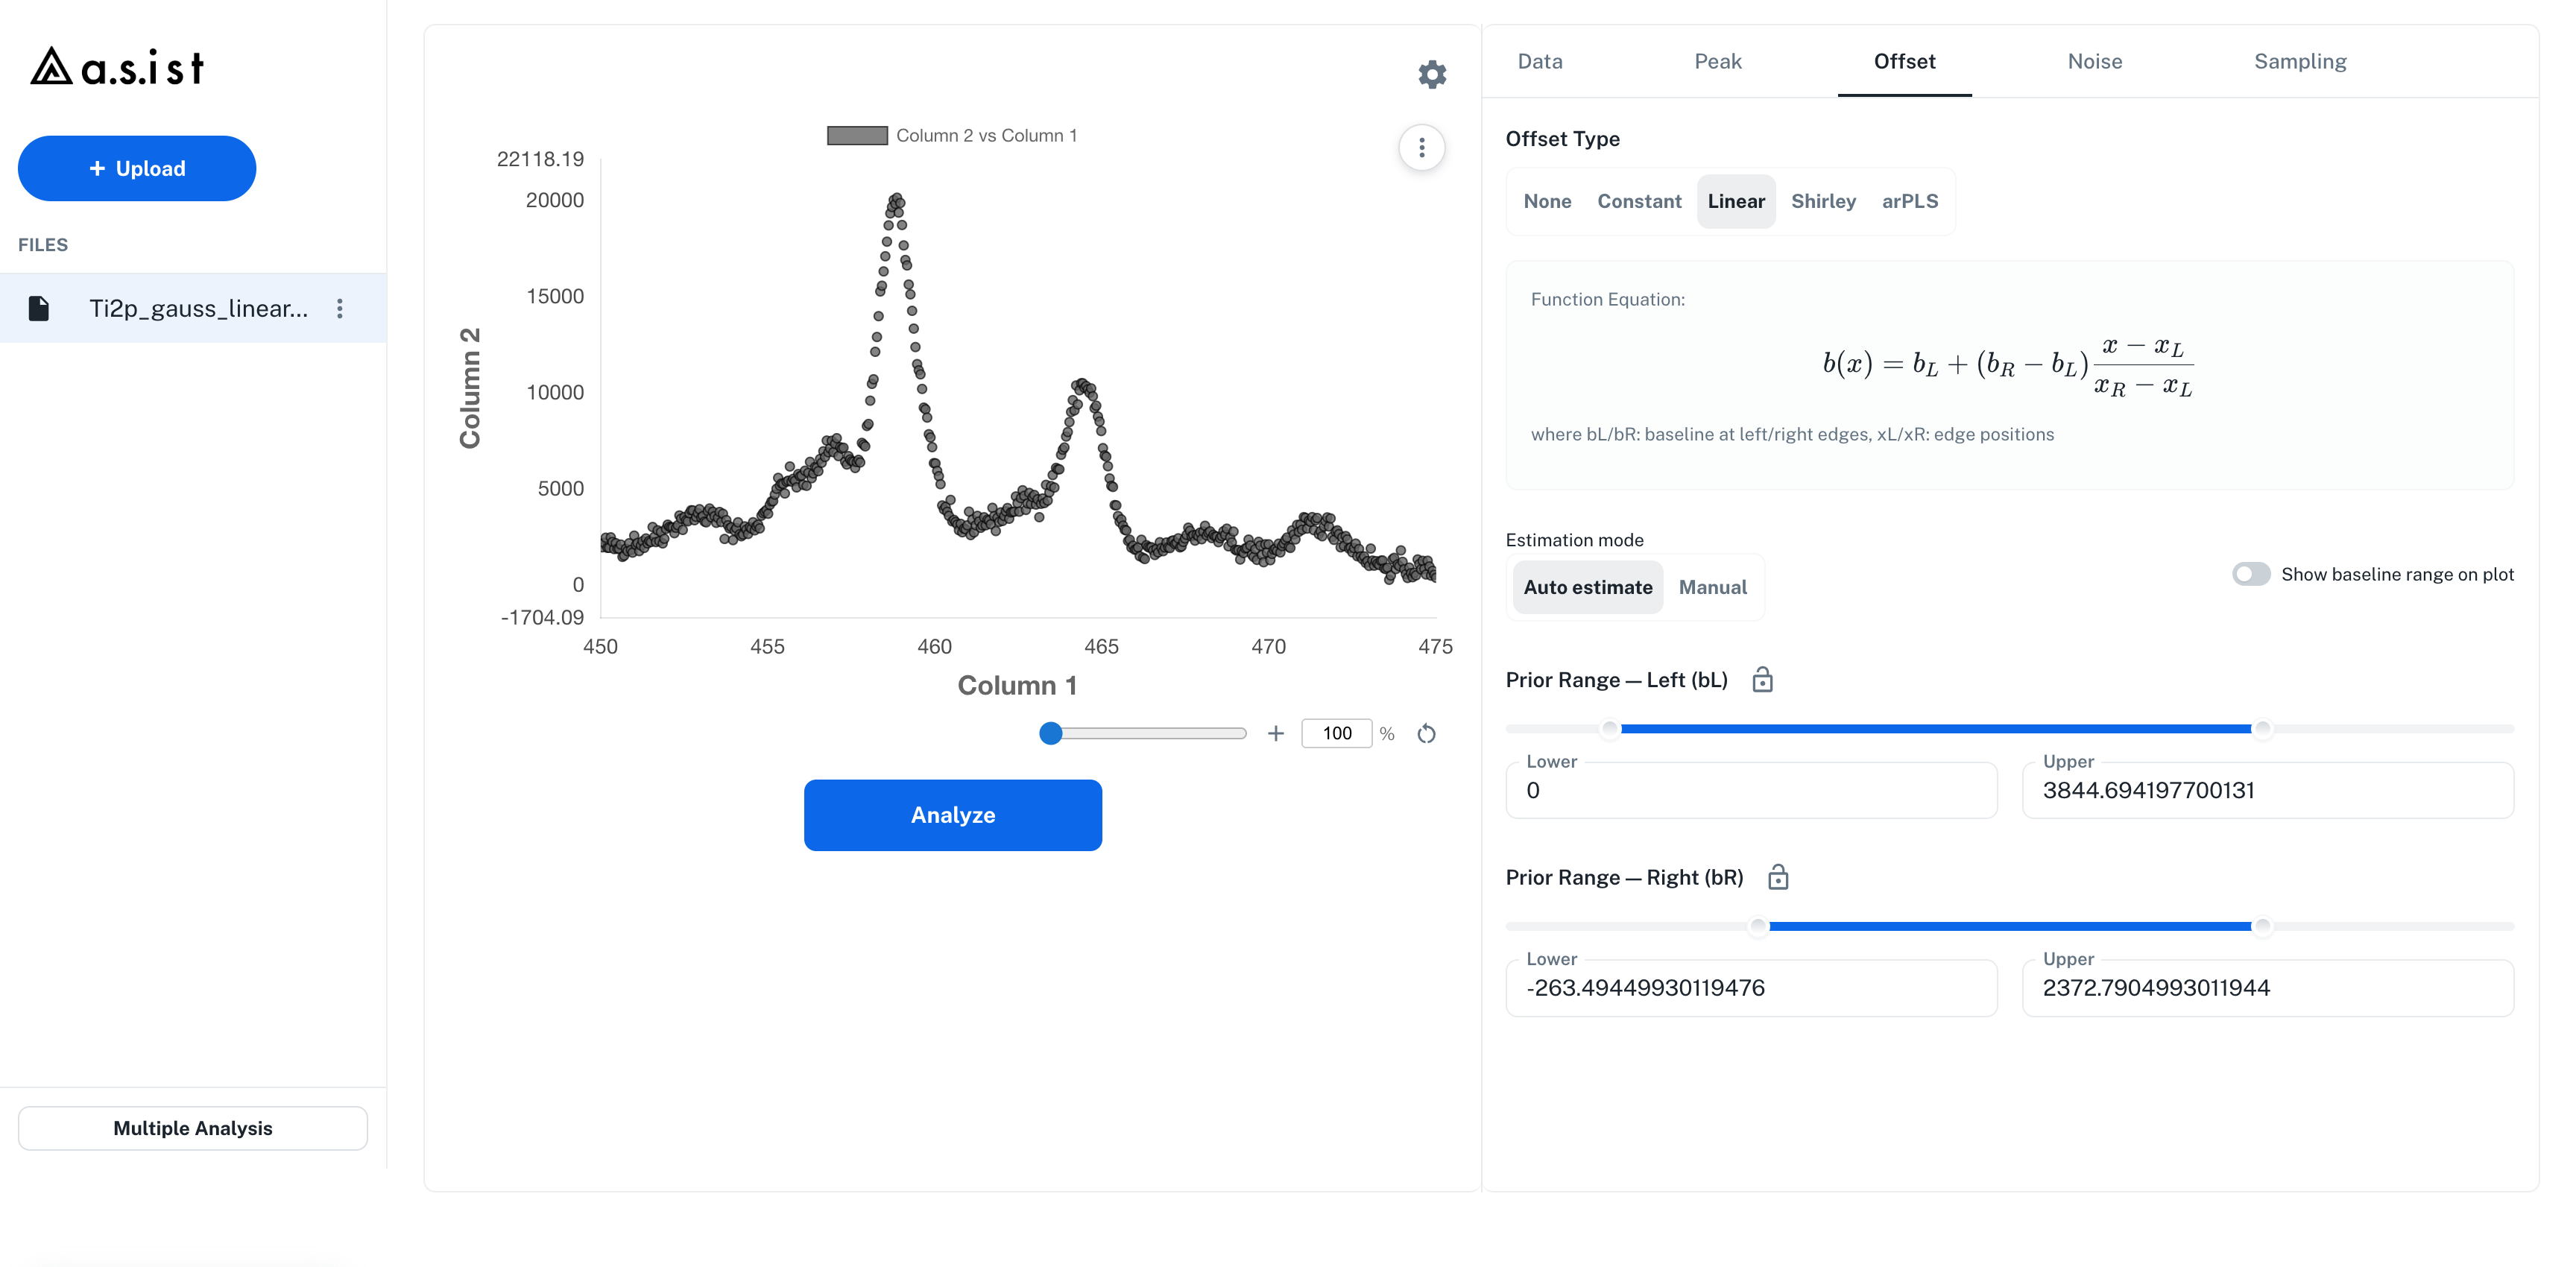
| Linear | \(b(x) = b_L + \frac{(b_R - b_L)(x - x_L)}{x_R - x_L}\) — linear interpolation between the left and right endpoint values |
| Shirley | Iterative background driven by peak intensity, with the left and right endpoint values as boundary conditions |
| arPLS | Automatic background via penalized least squares with iterative reweighting |
| Reference | Loads a reference spectrum with the same X coordinates and subtracts it before analysis |
The equation of the selected function is displayed below the selection buttons.
6.2 Estimation mode
When Constant, Linear, or Shirley is selected, an Estimation mode segmented control appears below it.
| Mode | Behavior |
|---|---|
| Estimate | The background values are included in the Bayesian estimation |
| Fixed | The background values are given as fixed values and not estimated |
Estimate Mode
Prior Rangesliders are displayed- For Linear / Shirley, specify the ranges for
Left (bL)andRight (bR) - For Constant, specify the range for
Constant (c) - Click the Lock icon next to each prior range to toggle between
RangeandFixed Value Rangeestimates over a lower-to-upper range, whileFixed Valuefixes a single value- Initial values are set automatically from the current data and can be restored with the reset icon.
- Turning ON the
Show baseline range on plottoggle displays the Constant / Linear / Shirley estimation ranges on the spectrum
Fixed Mode
- Instead of a prior range, a fixed-value input field for the background is displayed
- The analysis subtracts the background using the entered value (it is not estimated)
- Use the reset icon to restore the fixed value to its initial value
6.3 arPLS
Selecting arPLS displays a Smoothing Parameter λ (log₁₀ scale) slider and numeric input.
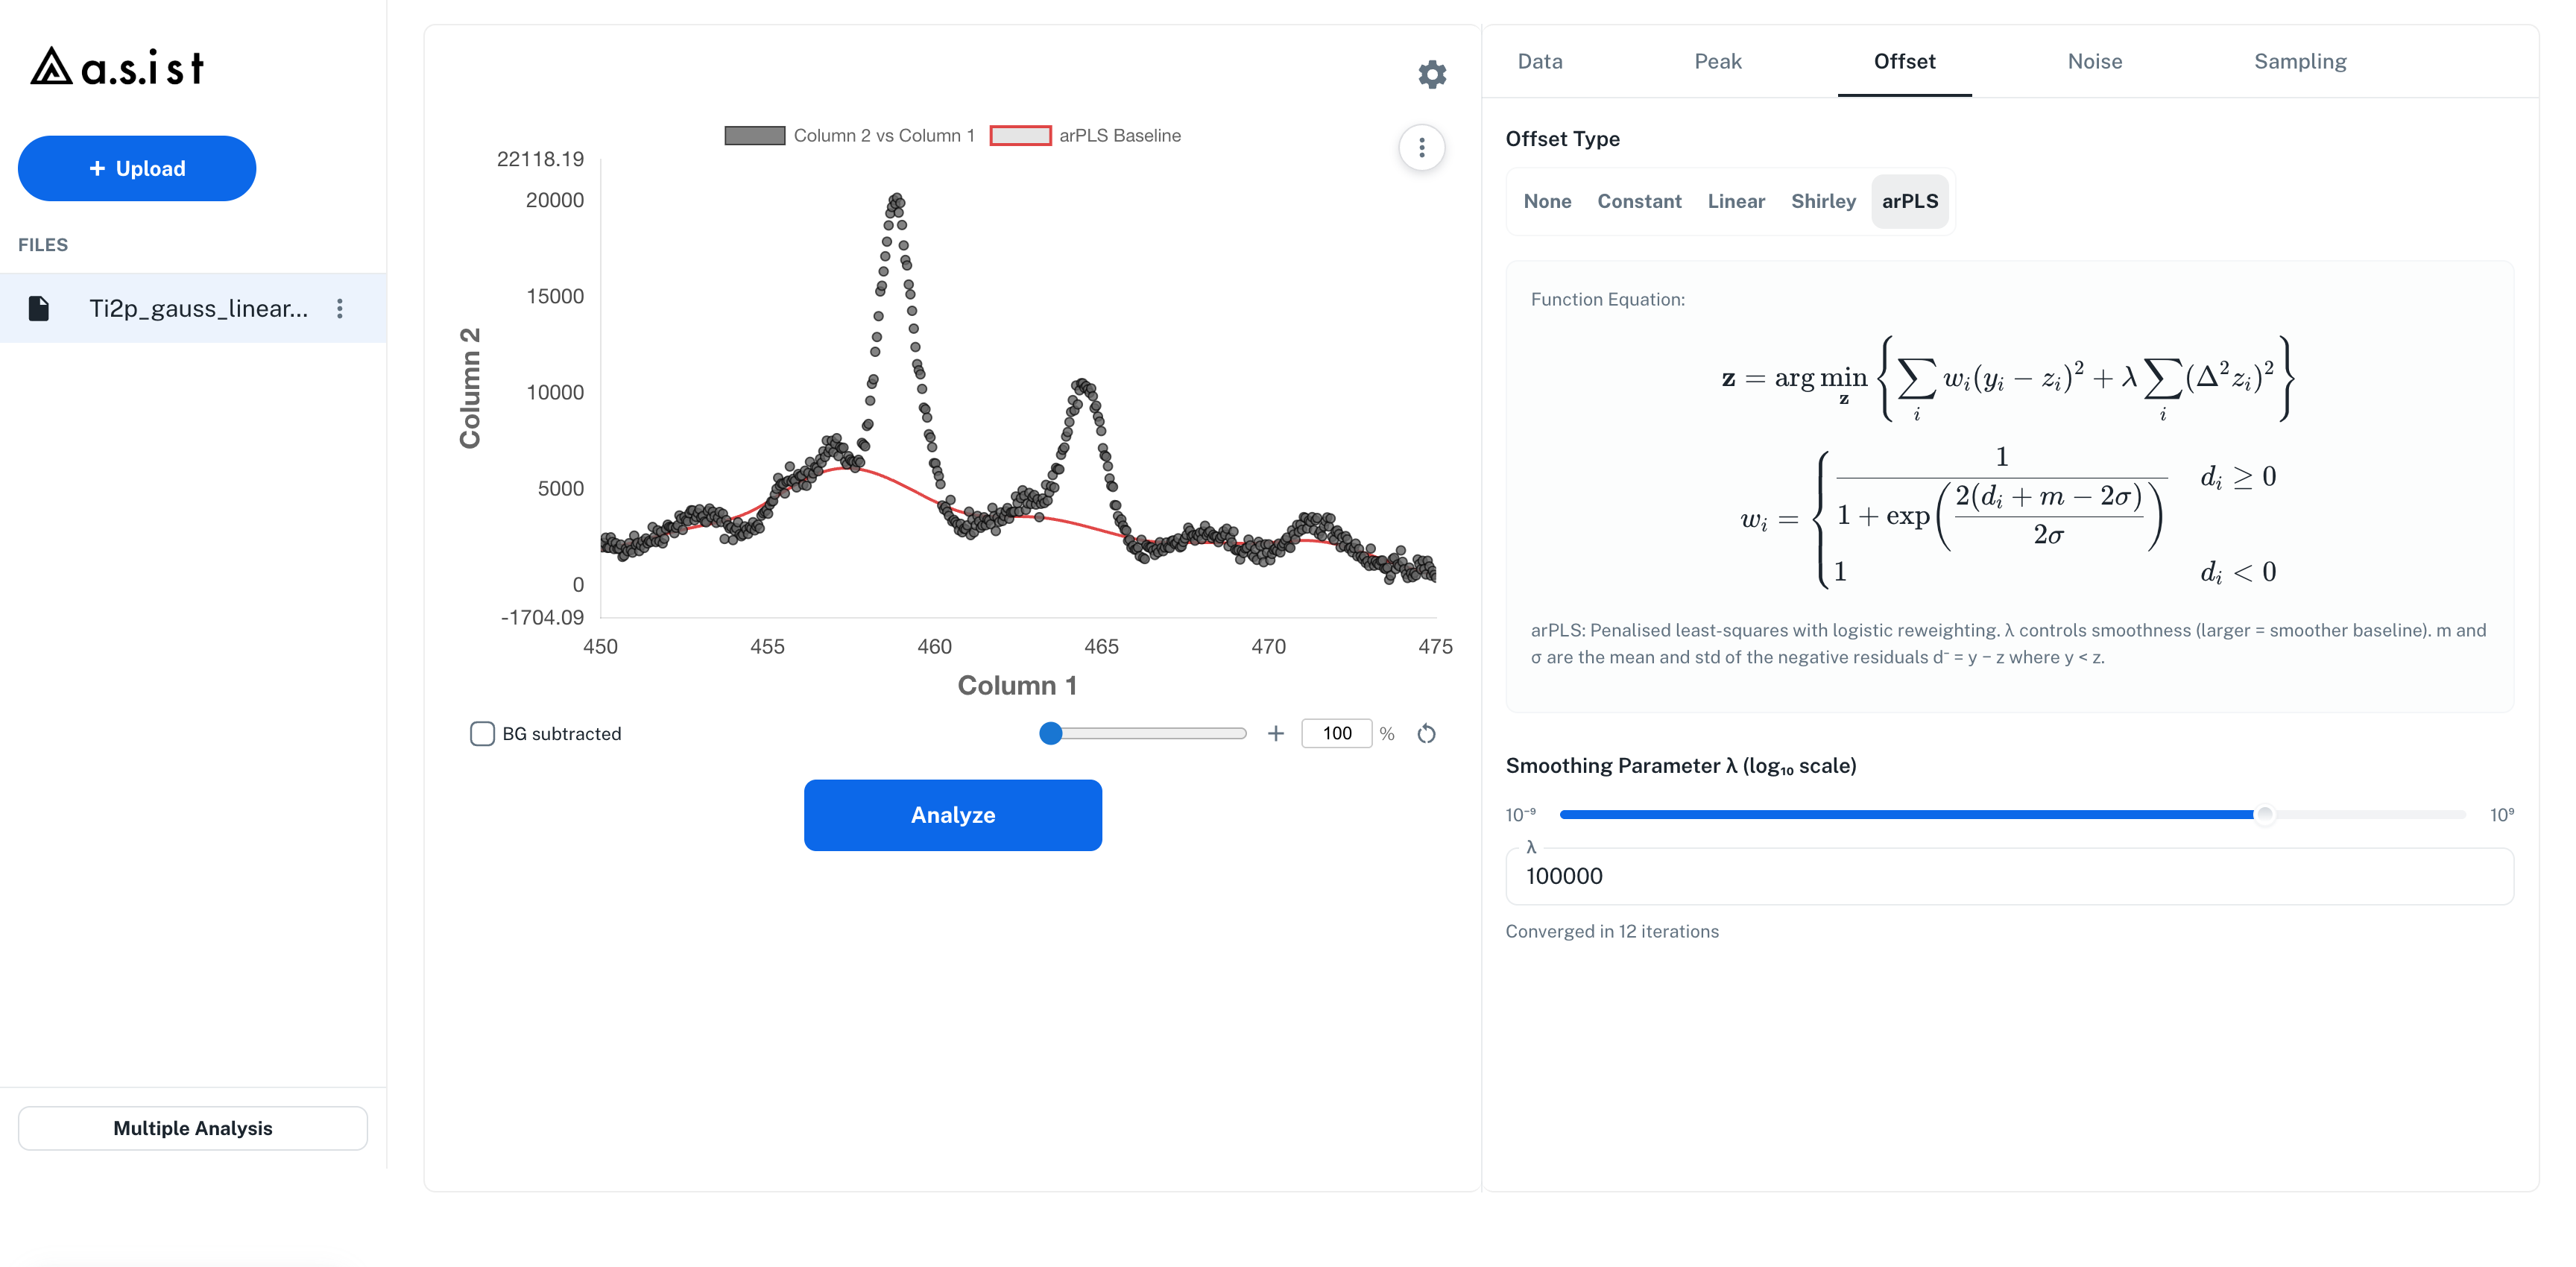
- Larger λ produces a smoother background (the initial value is 10⁵)
- arPLS computes the background before analysis and passes the corrected data to the peak fit
- The arPLS background is shown as a dashed line on the plot
- Endpoint background priors like those of Linear / Shirley are not used
6.4 Reference
Selecting Reference analyzes a spectrum corrected with reference values using the following equation.
Use Reference when you want to subtract values measured at the same X coordinates, such as instrument-derived dark / reference / blank data.
Uploading a Reference File
- Select Reference as the Offset Type
- Press Upload reference and choose a file containing the reference values (
.csv/.txt/.dat/.tsv/.xlsx/.xls) - In the Reference import settings dialog, confirm the reference name, row range, delimiter, X column, and Reference column
- Press Add reference to add the reference data to the Offset tab
- Use the References to subtract checkboxes to choose which references to subtract
For text files, use Start row (#) / End row (#) to specify which row range — such as Raw Data / Reference Data / Dark Data — to use as the reference. The Raw file preview in the dialog is scrollable, and the selected row range is highlighted.
The X values in the reference file must contain the same coordinates as the current data's X Axis in the same order. Even if the X Range is narrowed in the Data tab, the reference can be used as long as the reference data covers that X range.
Using an Uploaded Tab as a Reference
If spectra such as dark / reference are loaded as separate tabs in the same workspace, select the target tab from Uploaded tab in the Offset tab and press Use tab as reference.
The added reference is listed under References to subtract just like a file-derived reference. When multiple references are selected, the sum of all selected reference values is subtracted before analysis. For example, selecting both Dark and Reference passes Y - Dark - Reference to the analysis.
Effect on Analysis and Display
- Reference correction is applied before analysis.
- The reference background is displayed on the central plot so you can inspect the corrected values
- Because a reference is not an estimated background-function parameter, the Constant / Linear / Shirley prior ranges are not displayed
- To delete a reference, check the items to delete and press the delete icon