Chapter 9 Group Analysis
Group analysis is a feature that analyzes multiple spectra in a batch using the same prior. Use it when you want to compare multiple files from the same measurement series, the same set of samples, or under the same analysis conditions. The analysis results and outputs of each spectrum are kept independent; a group serves as a unit for organizing operations and display.
9.1 Creating a Group Folder
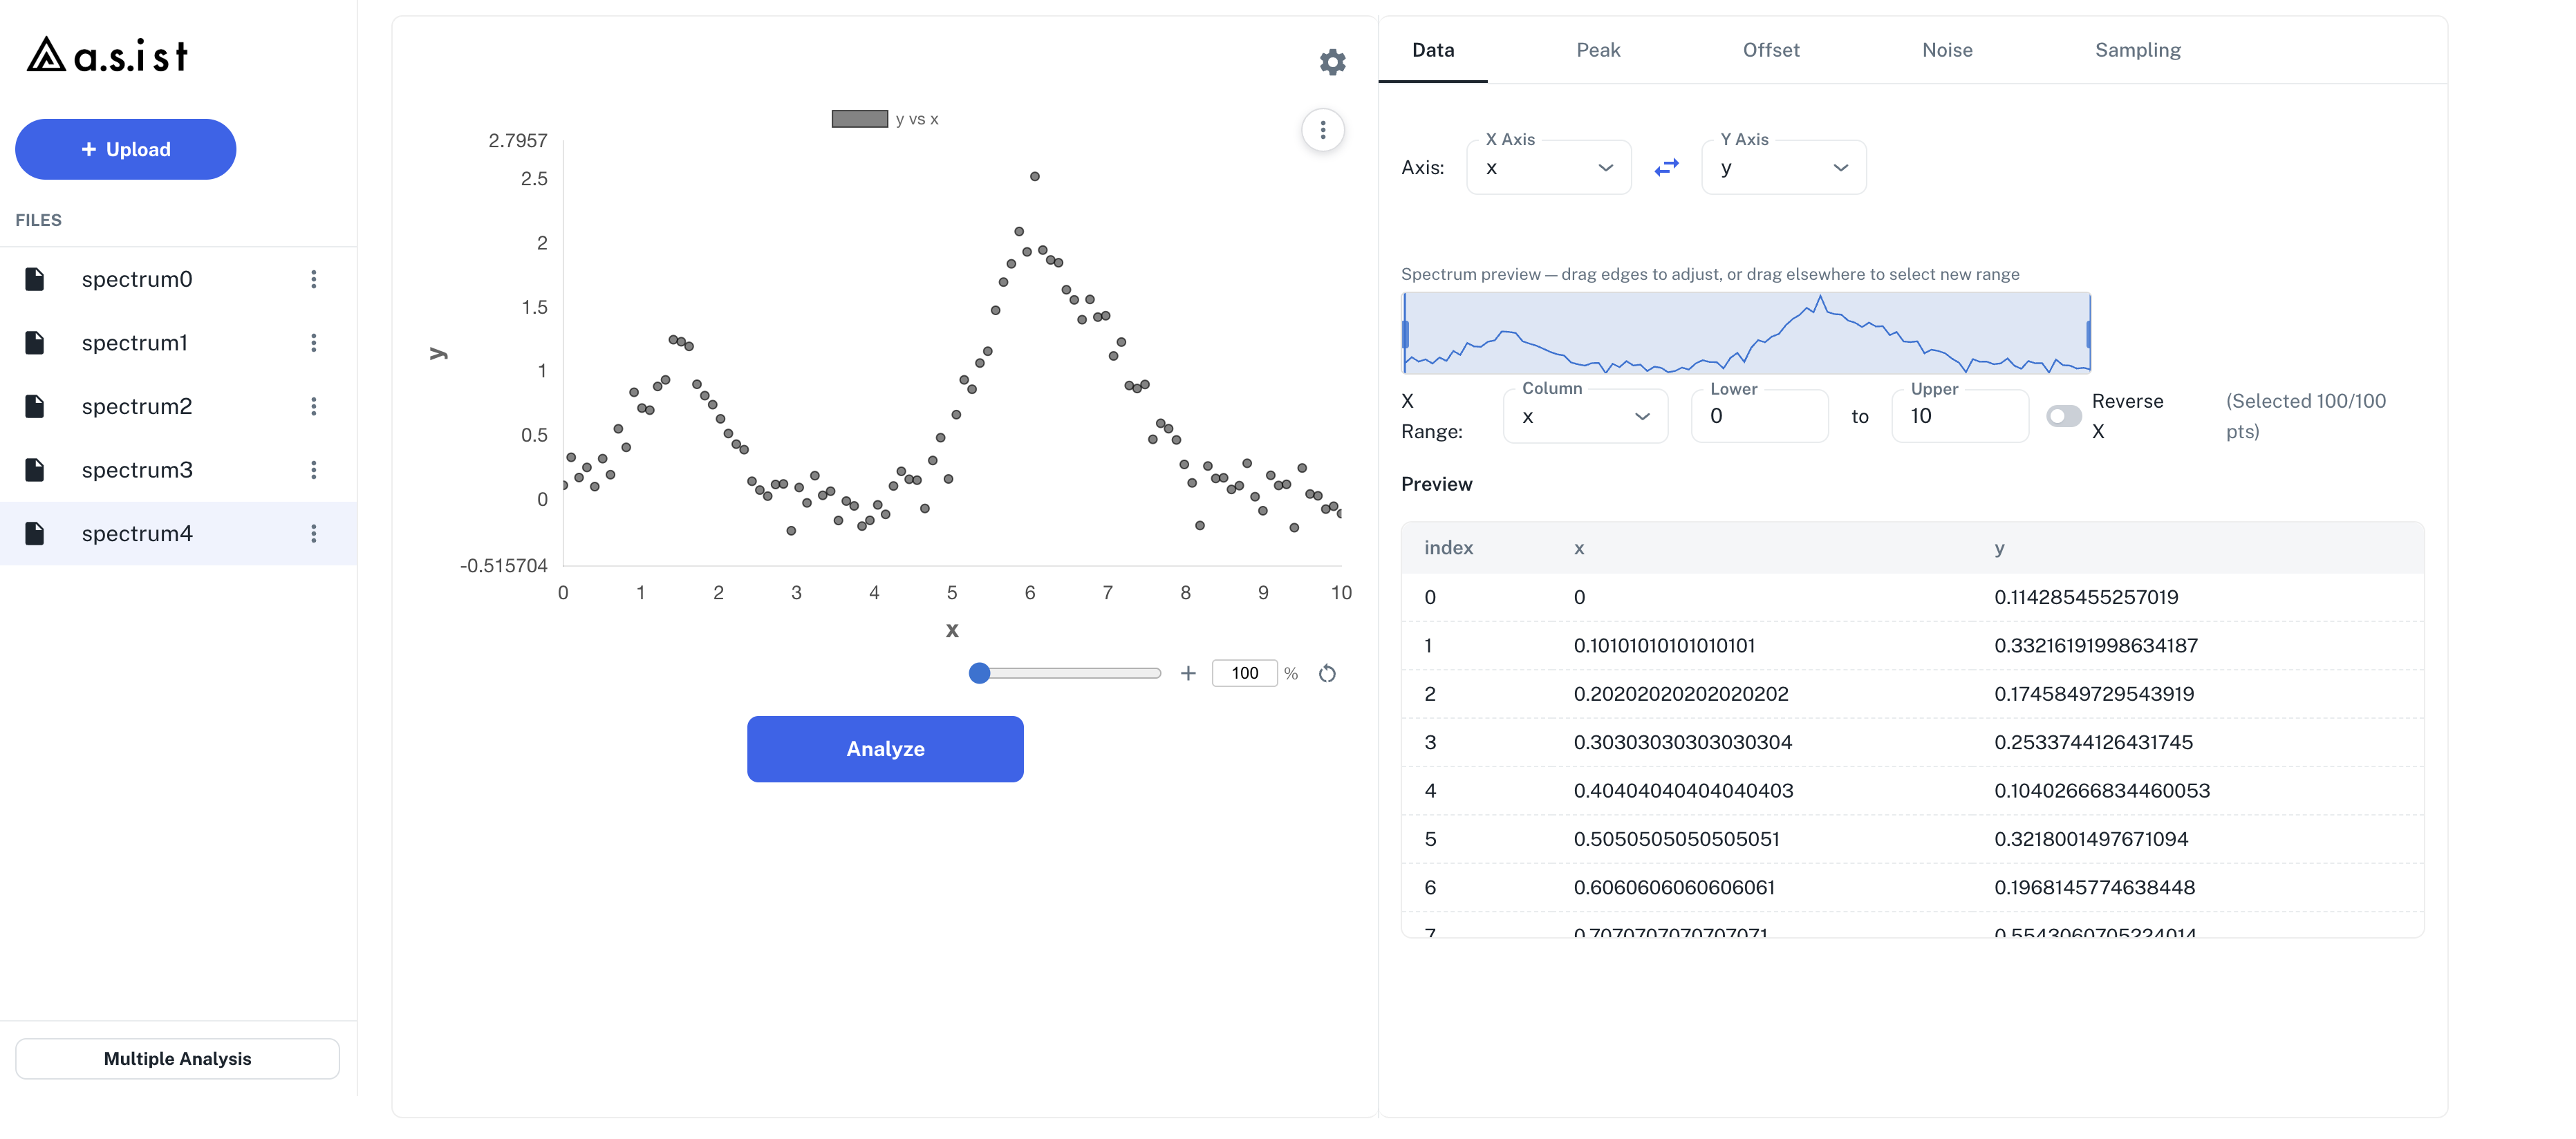
Immediately after loading multiple files, each file appears individually in the sidebar. To perform a group analysis, create a group folder from Multiple Analysis. Under the group folder, the spectra to be analyzed are listed as data items.
Basic steps:
- Select multiple files via
+ Uploadat the top of the left sidebar - Check the data range and columns of each file in Import Settings
- After loading, review each data item in the Files sidebar
- Press Multiple Analysis to open the Create Multiple Analysis Group dialog
- Enter a group name, select the data to include in the group, and press Create
- Select the group folder to open the group analysis settings
9.2 Preview Dropdown
At the top of the group analysis screen there is a Preview dropdown. The preview and plot of the data selected in Preview are shown in the group panel.
How to use:
- Select the group folder
- Open the Preview dropdown
- Select the spectrum you want to display
- Review the Data / Peak / Offset / Noise / Sampling settings in the group panel
Switching the Preview only changes which data is displayed. The source of the shared analysis conditions is chosen with Params Source.
9.3 Params Source Dropdown
The Params Source dropdown selects which spectrum in the group is used as the copy source for the shared conditions. The Peak / Offset / Noise / Sampling / prior settings of the selected source are synchronized to the group panel and to each data item.
Main items that are synchronized:
- Peak Functions
- Model search range
- Peak Priors / Set per peak
- Area Ratio Constraints
- Offset type / Estimation mode / prior range
- Noise model / Estimation mode
- Sampling settings
- X/Y axes (when a column with the same name exists in the data)
- Analysis range (when the axes can be synchronized)
Behavior When Column Names Do Not Match
If the X/Y axis names of the Params Source exist among the column names of a data item, those axes are used. When row numbers are used as the X axis, synchronization can work without a matching column name.
If a column name does not exist, the data item's default axes are used. The analysis range is synchronized within the group only when both X and Y can be synchronized. Even when the axes cannot be synchronized, the Peak / Offset / Noise / Sampling conditions are synchronized to the extent possible.
9.4 Analyze all
On the group analysis screen, the Analyze button is labeled Analyze all. Clicking it applies the shared conditions to each data item in the group and starts the analysis.
Execution steps:
- Select the Params Source
- Review the shared settings in the group panel
- Click Analyze all
- Monitor the overall group progress with the circular progress indicator
- After the analysis completes, switch between data items in the results area to review them
Progress display:
- Shows the overall progress percentage for the group
- Tracks the completion status of each data item
- Shows the group results area once all data items are complete
In the Web version, the analysis of each data item consumes GPU analysis time. For groups with many data items, verify your conditions with a small number of items first before running the full group.
Sleep Detection and Resume
If the PC goes to sleep while a group analysis is running, a dialog stating that the analysis was stopped because PC sleep was detected appears on wake. The results of completed data items are preserved, and you can resume the unfinished items from a confirmation prompt asking whether to resume the N unfinished items.
9.5 Switching Between Results of Each Data Item
In the group analysis results area, you can switch between the results of the analyzed data items. The result plots are shown below the data selection tabs.
What you can review:
- Free Energy and Posterior Probability
- Best Fit
- Parameter Posterior Distribution
- Error Function Trace (CPU version only)
- MAP and 95% Credible Intervals
- Plot Settings
- Inline editing of axis labels / legend labels
0-base peakstoggle
The same operations available on the regular results screen can also be used on the group result plots. Plot Settings and inline labels are used for the current data item's image exports and PDF reports.
9.6 Export
In the group analysis results area, the Export split button lets you export the currently displayed data item (Active) and all data items (All datasets) separately.
Export results (CSV) – Active
Saves only the currently displayed data item as a ZIP. A <timestamp>-<data name> folder is created directly under the ZIP root, containing the same root/model folder structure as a single-spectrum Results ZIP.
Export results (CSV) – All
Saves all analyzed data items in the group together as a ZIP. Folders named after each data item are placed directly under the ZIP root, each containing the same root/model folder structure as that data item's Results ZIP.
Export report (PDF) – Active
Saves only the currently displayed data item as a PDF report. The edited axis labels, legend labels, and Reverse X are used in the report.
Export report (PDF) – All
Creates a PDF report for each analyzed data item in the group and bundles them into a single ZIP.
Export images (PNG) – Active
Saves the plot images of the currently displayed data item as a ZIP.
Even in group analysis, the results of each spectrum are independent. This is not a feature that outputs a single averaged spectrum or a combined fit.