Chapter 3 Screen Layout
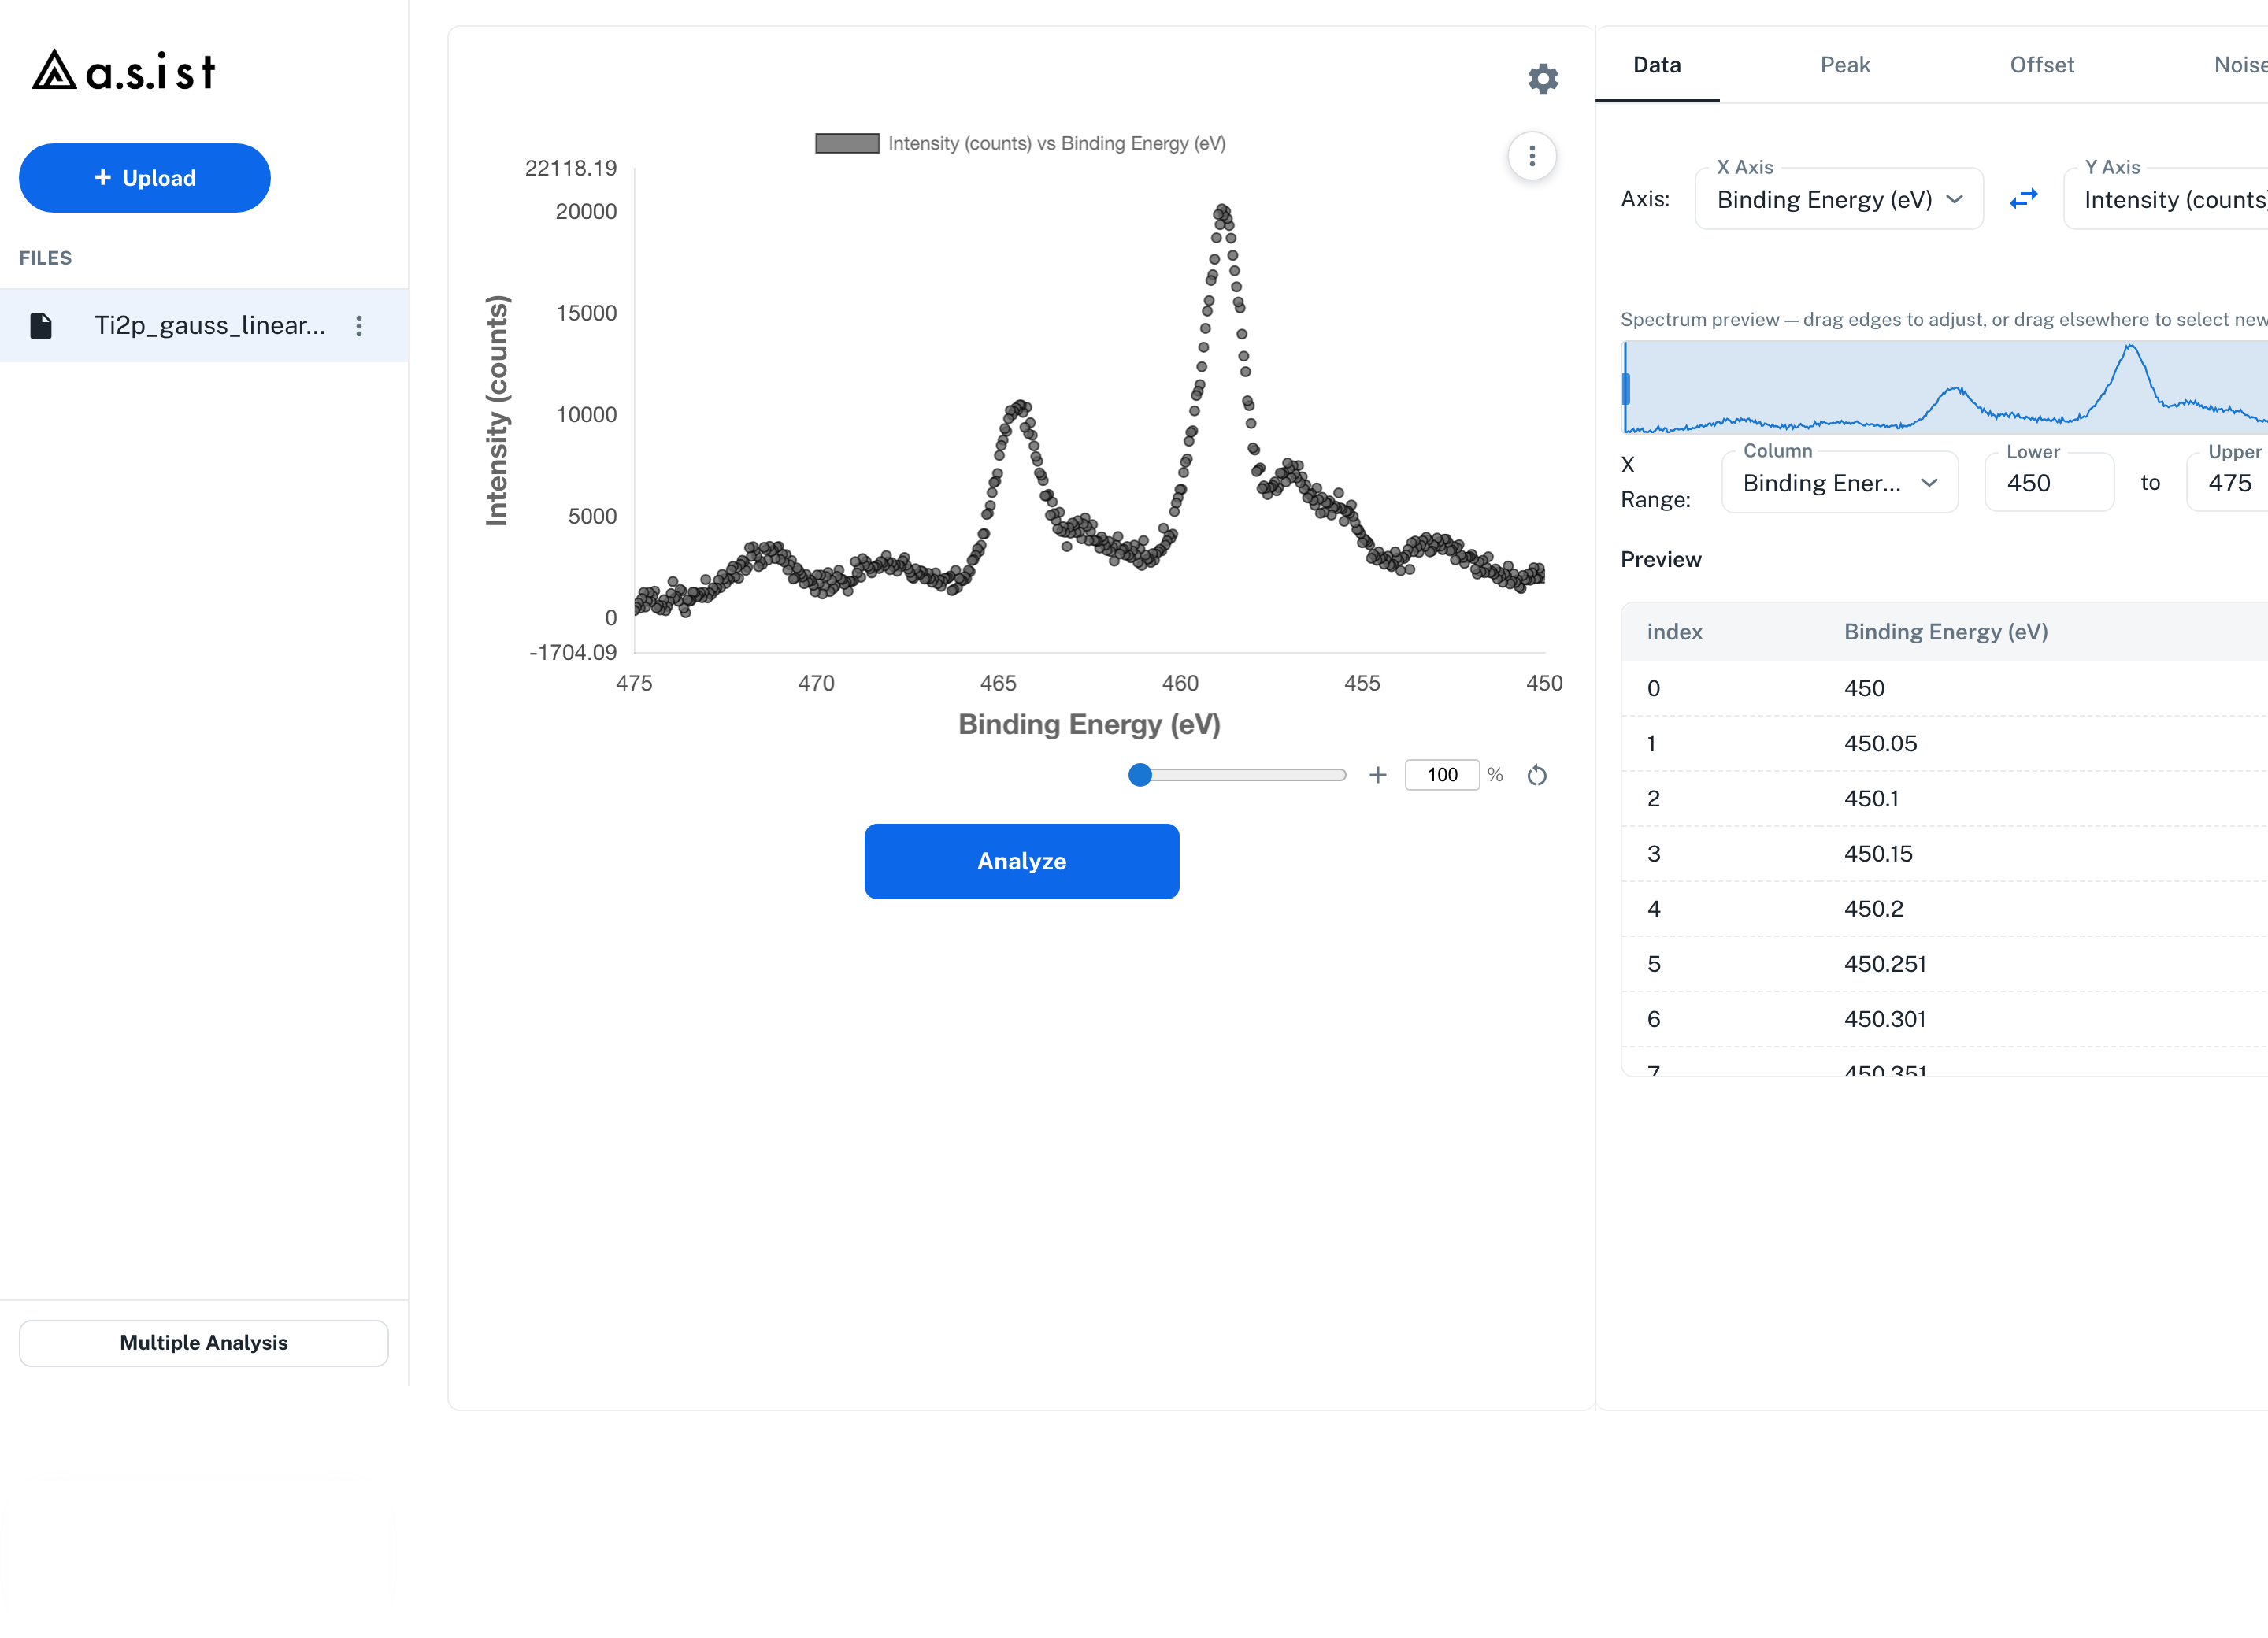
The main screen consists of the Files sidebar on the left, the plot area in the center, and the settings tab panel on the right. Even on wide monitors, the Files sidebar, plot area, and settings tab panel are displayed together as a single working area.
3.1 Upload Button
Use the + Upload button at the top of the left sidebar to upload the data files you want to analyze. Loaded files appear under Files. Simply loading multiple files does not automatically form an analysis group; to run a group analysis, create a group from Multiple Analysis. See Chapter 4 for details.
3.2 Files Sidebar
In the Files sidebar, select loaded datasets and groups.
- Click a dataset to display its spectrum in the center plot and the right tab panel
- Click a group folder to work with Preview / Params Source / Analyze all for group analysis
- Use each dataset's menu to rename or delete it
3.3 Center Plot Area
Before running an analysis
- The entire spectrum is shown as a scatter plot (X axis: the selected X column, Y axis: the selected Y column)
- Adjust the zoom level with the
+/-buttons or thezoomslider at the bottom - You can also type a zoom level directly into the
100 %text box - The reset icon restores the default zoom level (100 %)
- The gear button opens the Plot Settings dialog
Plot Settings
Plot Settings lets you adjust how the plot is displayed.
| Item | Description |
|---|---|
| Axis Settings | Font size of axis labels and axis ticks |
| Legend Settings | Show / hide the legend, font size |
| Data Marker Settings | Marker size, marker color, and outline color and width of data points |
| Fit Line Settings | Width of fit lines and the color of each line |
You can edit axis labels directly by double-clicking the axis title on the plot. Legend labels can also be edited by double-clicking a legend item. Edited axis labels, legend labels, and the legend show / hide setting are also used in exported images and reports. Font size, marker, and line settings apply only to the on-screen display and are not reflected in exported images.
Analyze button
The Analyze button is located at the bottom of the center plot. Once the settings are in place, start an analysis from this button (see Chapter 8).
After running an analysis
Result plots such as Model selection (selection of the optimal number of peaks), Free Energy and Posterior Probability, Best Fit, Parameter Posterior Distribution, and Error Function Trace (CPU edition only) are stacked below the main plot (see Chapter 10).
The Best Fit plot provides a 0-base peaks toggle. When ON, each peak component is drawn relative to zero rather than on top of the background.
3.4 Right Tab Panel
The settings are organized into five tabs.
| Tab | Role | Chapter |
|---|---|---|
| Data | Axis selection, X/Y display range, data preview | Chapter 4 |
| Peak | Search range for the number of peaks, Peak Functions, Peak Priors, Area Ratio Constraints | Chapter 5 |
| Offset | Background type and prior settings | Chapter 6 |
| Noise | Noise model and prior settings for \(\sigma\) | Chapter 7 |
| Sampling | Total samples setting | Chapter 8 |
3.5 Analyze Button
Start an analysis with the Analyze button at the bottom of the center plot. In group analysis, the button in the same position reads Analyze all and analyzes all datasets in the group at once.