Chapter 4 Data Loading
4.1 Supported File Formats
| Format | Extensions |
|---|---|
| CSV | .csv |
| TXT | .txt |
| VAMAS | .vms / .npl |
| PHI SOFH | .spe / .pro / .ang |
| Excel | .xlsx |
CSV / TXT files are read as UTF-8 first; if the text is garbled, they are read as Shift_JIS / CP932. Output files from measurement instruments that contain Japanese text can be uploaded as they are.
4.2 Upload Procedure
- Click the
+ Uploadbutton at the top of the left sidebar - Select the target files in the file selection dialog
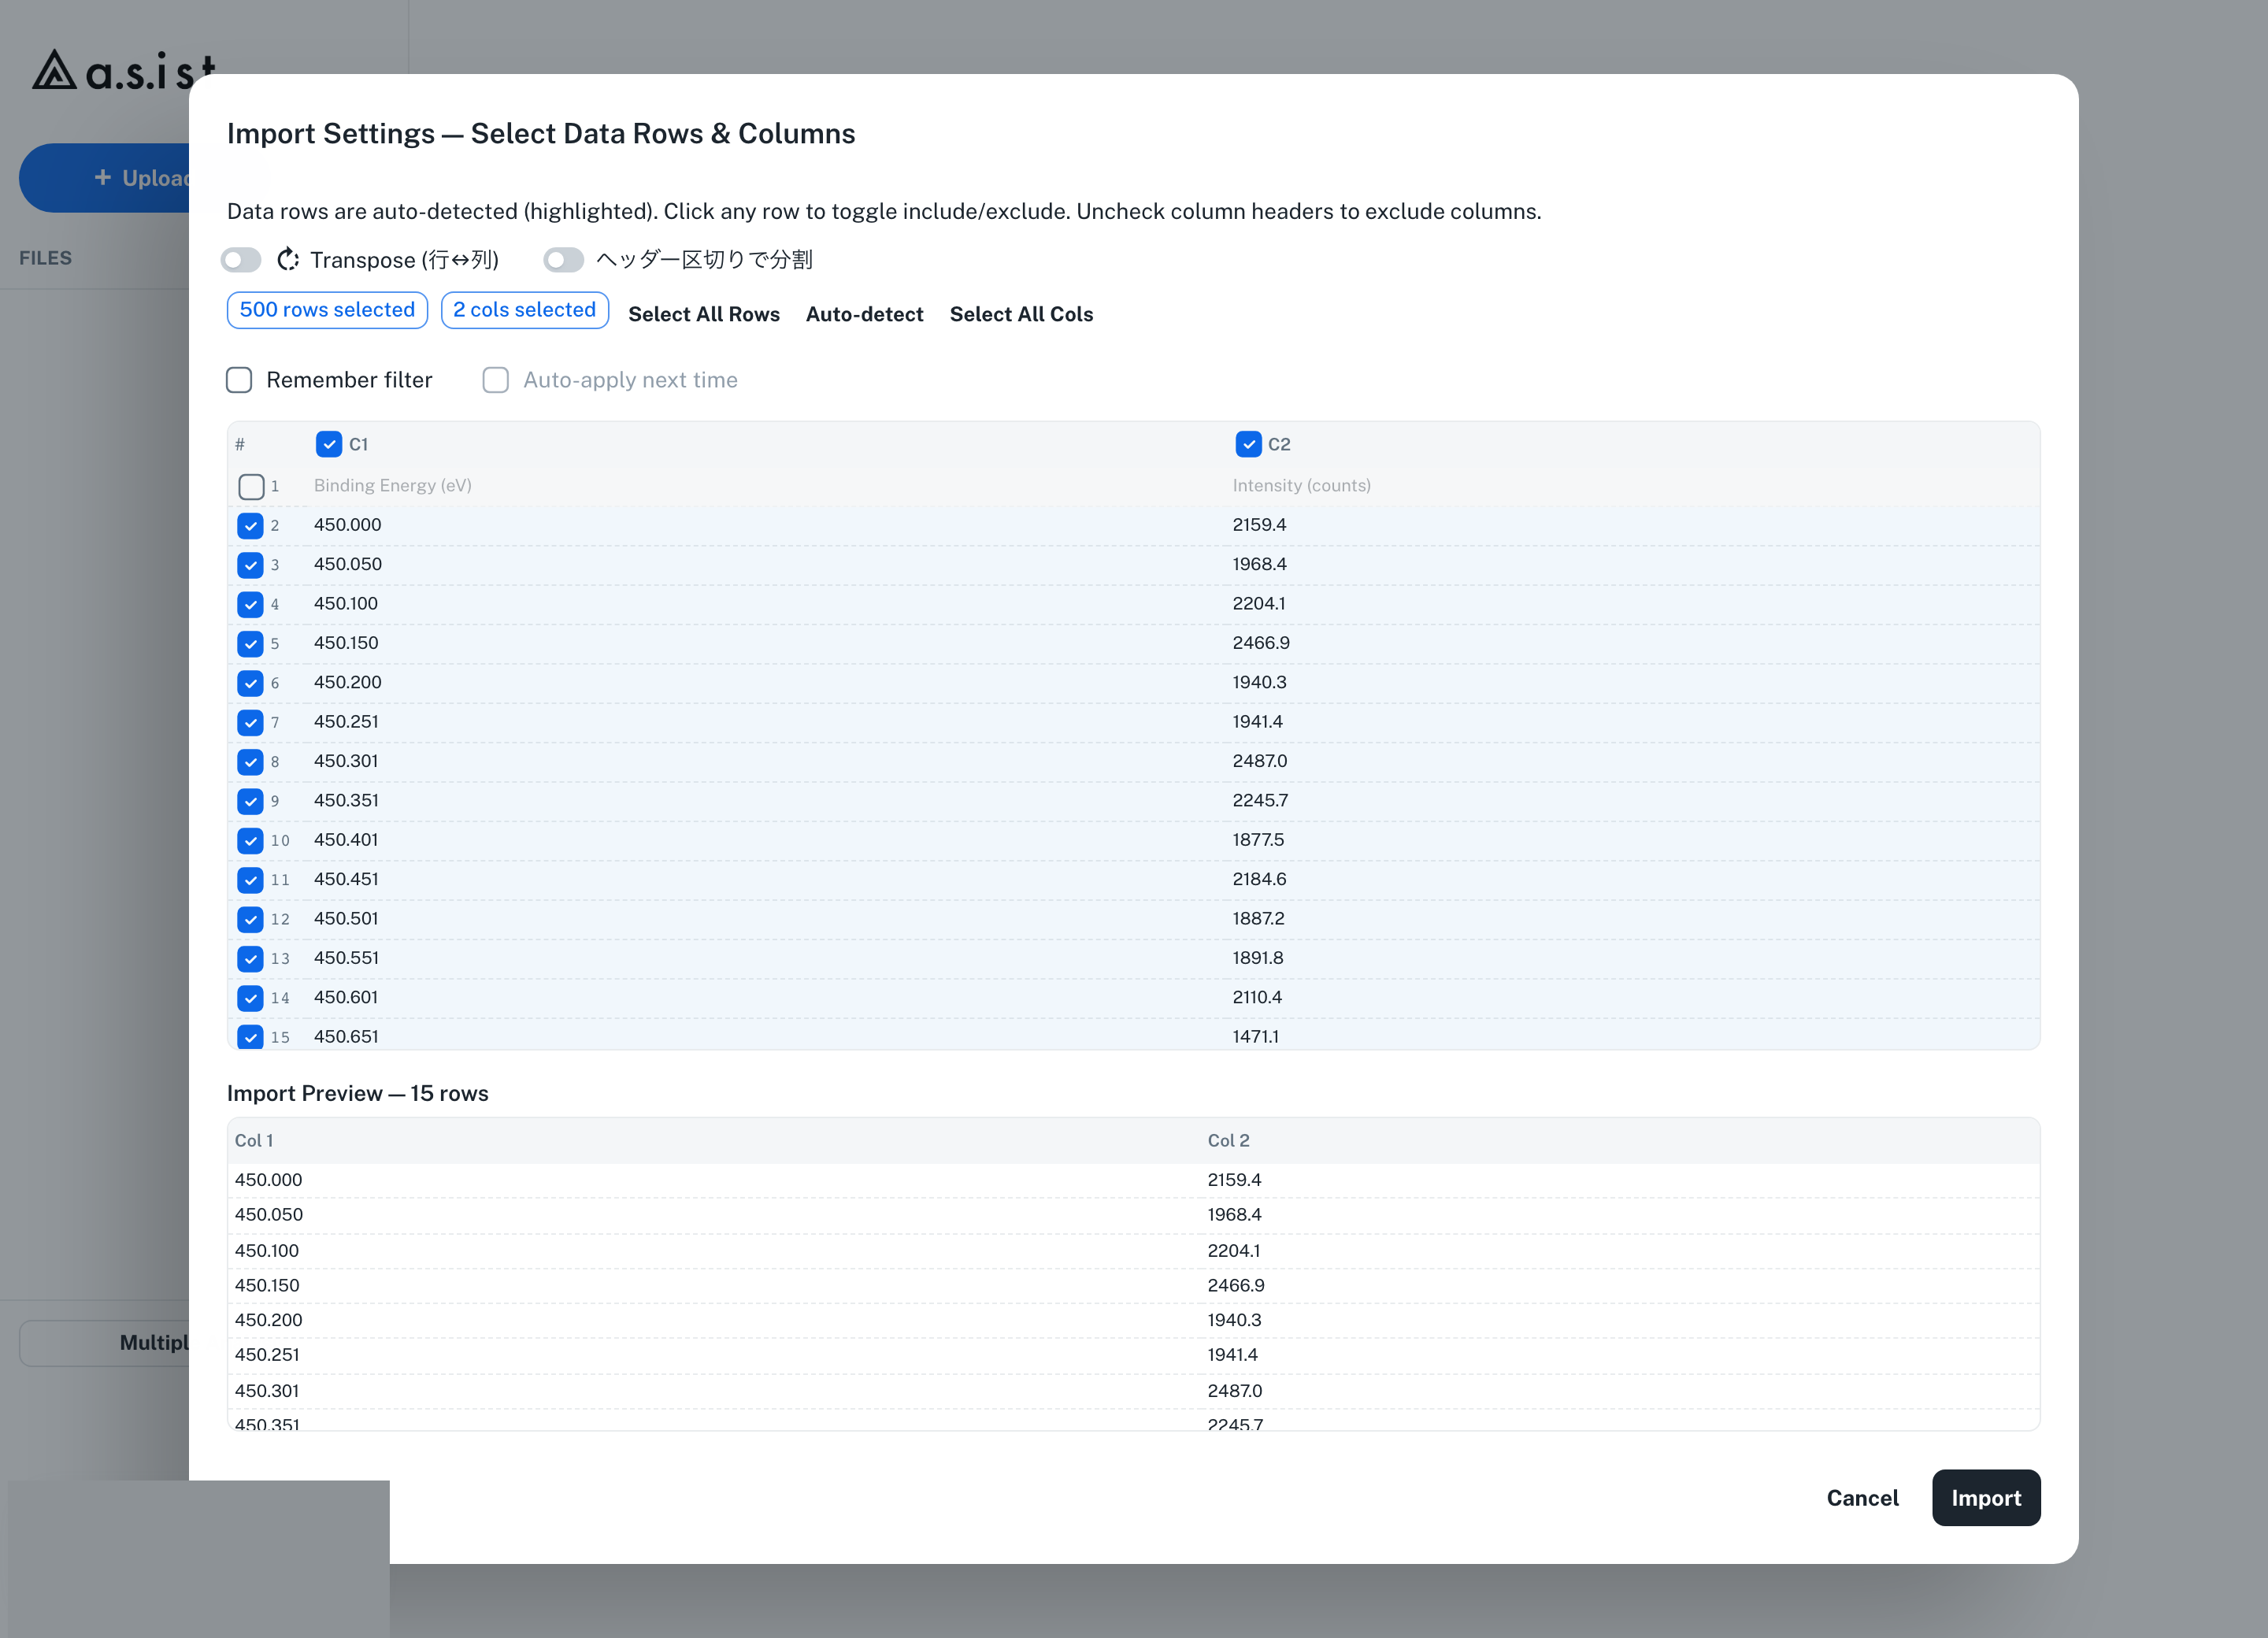
- For CSV / TXT files, the Import Settings dialog opens
- Automatically detected data rows are highlighted. Click a row number to toggle whether that row is included in or excluded from the import
- Use the checkboxes in the column headers to exclude unnecessary columns
- Use
Start row (#)/End row (#)with Apply row range to specify the row range to import by row number - Use Select All Rows / Select All Cols to select rows and columns in bulk
- Data rows and columns are detected automatically on load. To redo the detection, press Auto-detect
- Toggle Transpose rows/columns if needed
- For files where the same header repeats, use Split by repeated headers to split the file into blocks
- When you repeatedly load files of the same format, use Remember filter / Auto-apply next time to reuse the row and column selection
- Confirm the import with the Import button
After loading, the spectrum is displayed in the main screen plot.
Loading VAMAS / PHI SOFH / Excel files
VAMAS (.vms / .npl), PHI SOFH (.spe / .pro / .ang), and Excel (.xlsx) files are read directly by dedicated parsers, and the Import Settings dialog does not open. Blocks / sheets in the file are expanded automatically, and manual row/column selection and Transpose are not available. If the file contains multiple Y columns, the multi-Y-column dialog described next opens.
Files with multiple Y columns
When a single file contains an X column and multiple Y columns, the How to import multi-axis data? dialog opens.
- As a single dataset (keep all Y columns): load the file as one dataset and switch the Y Axis in the Data tab
- Split into separate datasets by Y column: load each Y column as a separate spectrum and create a group in the Files sidebar
If you choose Split, select the shared X column under X axis and the Y columns to analyze under Select Y axes (multiple). Each spectrum is created from the selected X column and one Y column. After loading, select each tab in the group to review the Peak / Offset / Noise / Sampling settings individually.
For files with duplicate column names, internal column names and dataset names in the Files sidebar are made unique, e.g. Z[um] (2). Plot axis labels use the original column names, so axis titles for the same measurement series do not carry unnecessary numbers.
4.3 Multi-file Workspace
- Upload multiple files: select multiple files from
+ Upload. Right after uploading, each file is listed individually in the workspace's Files sidebar. At this point, no group folder has been created yet.
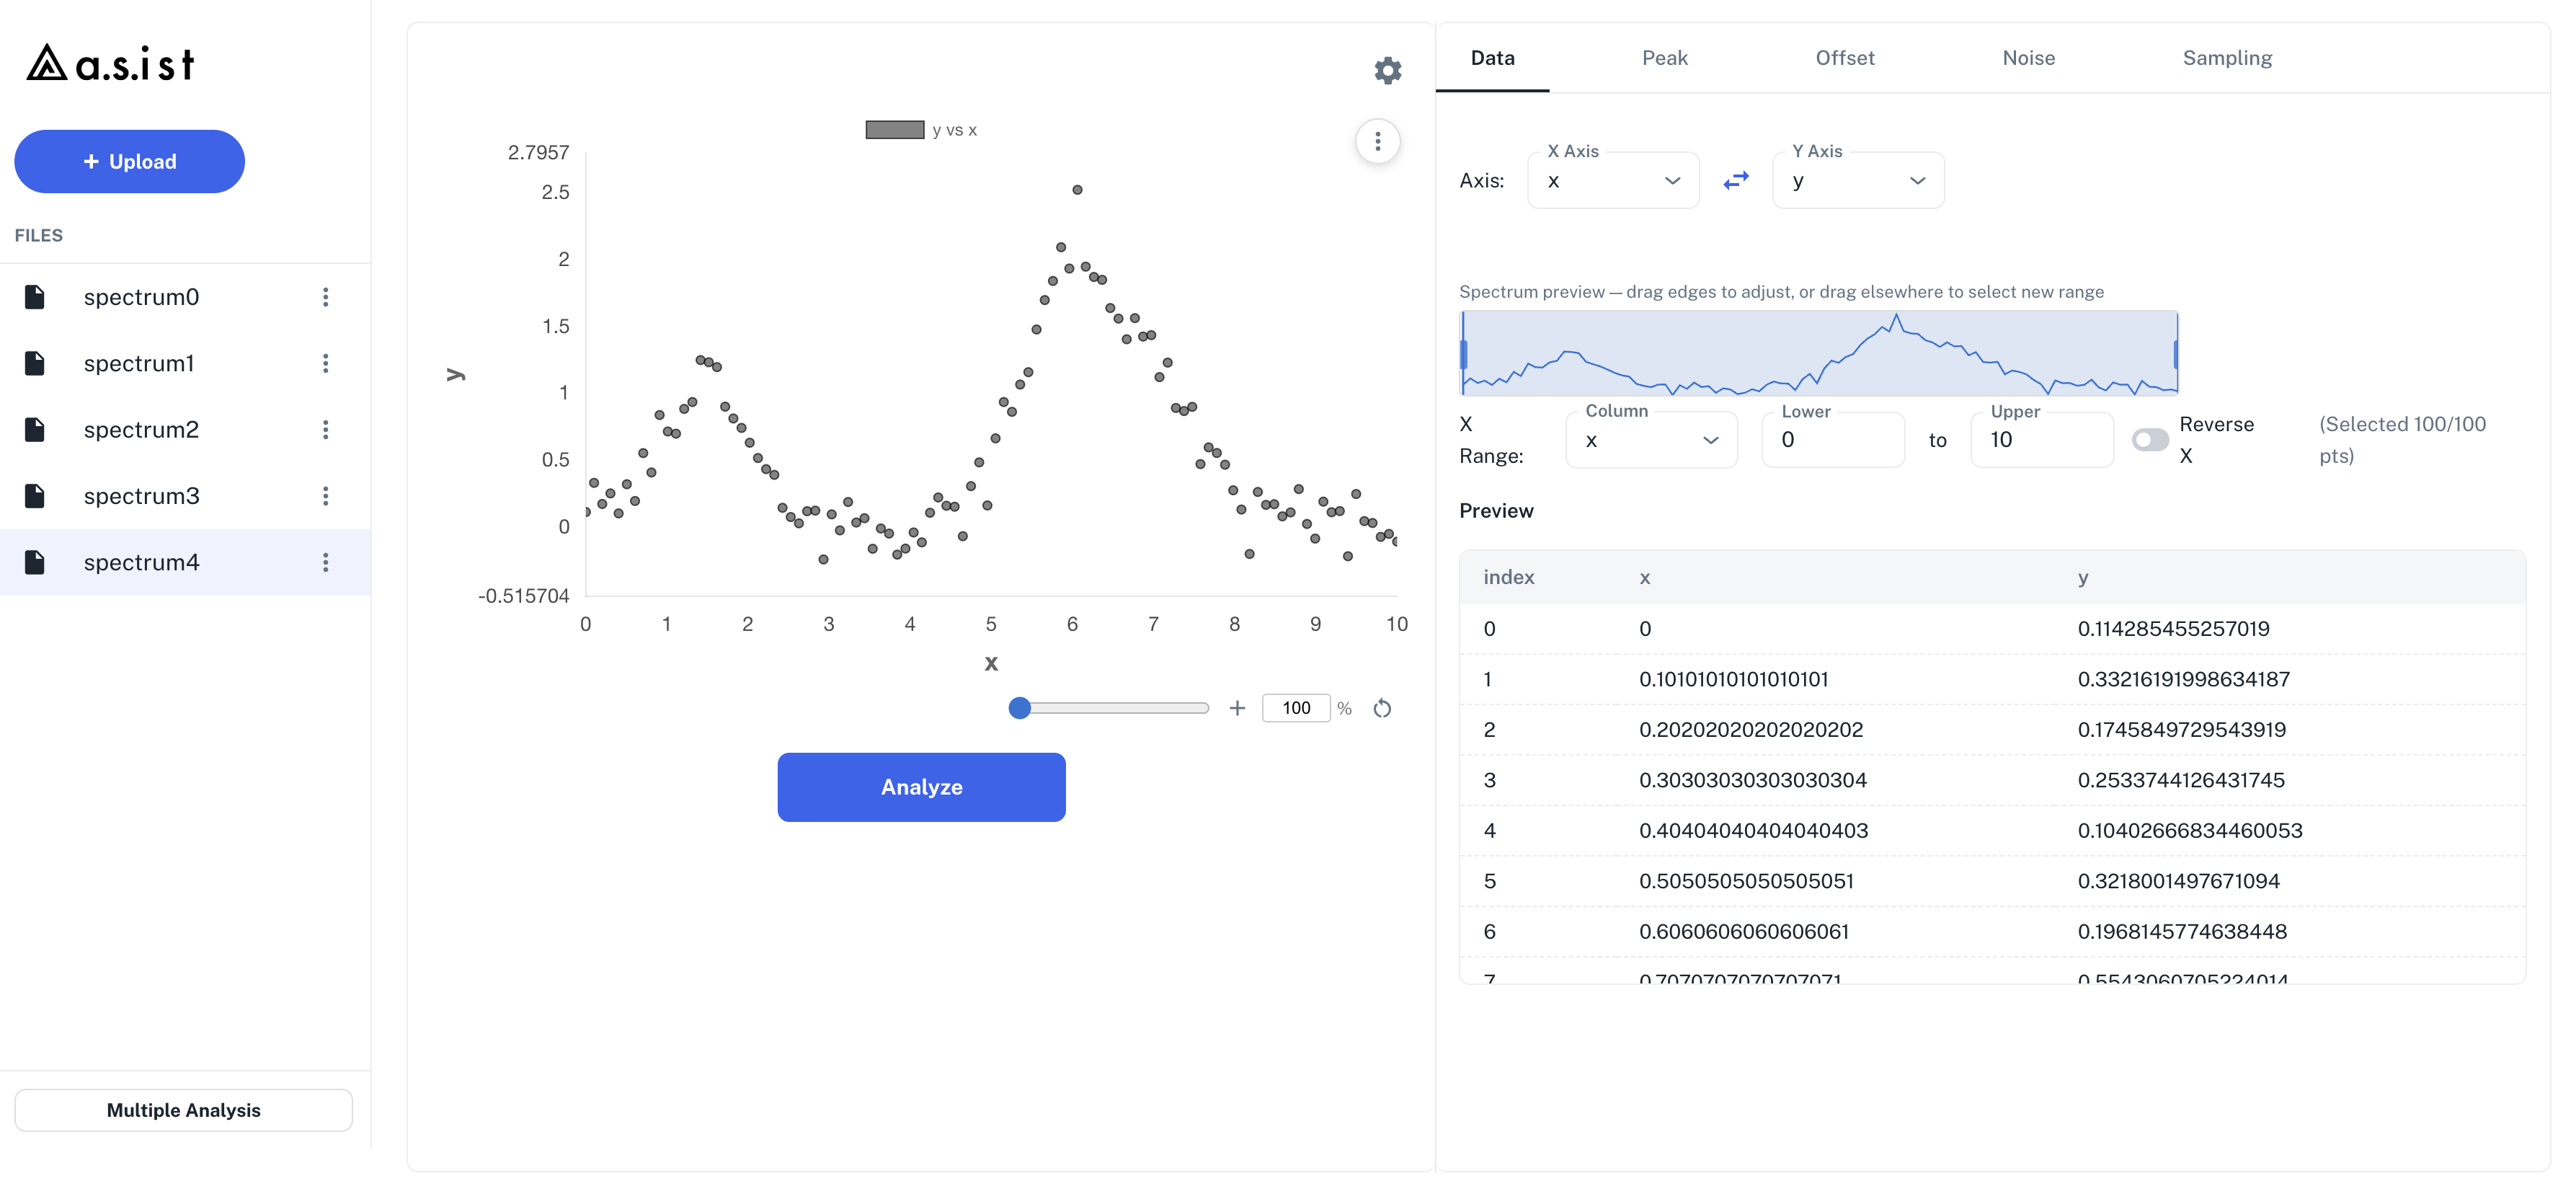
- Press the Multiple Analysis button: pressing the Multiple Analysis button at the bottom of the workspace opens the Create Multiple Analysis Group dialog. Enter a group name and select the files to include in the group.
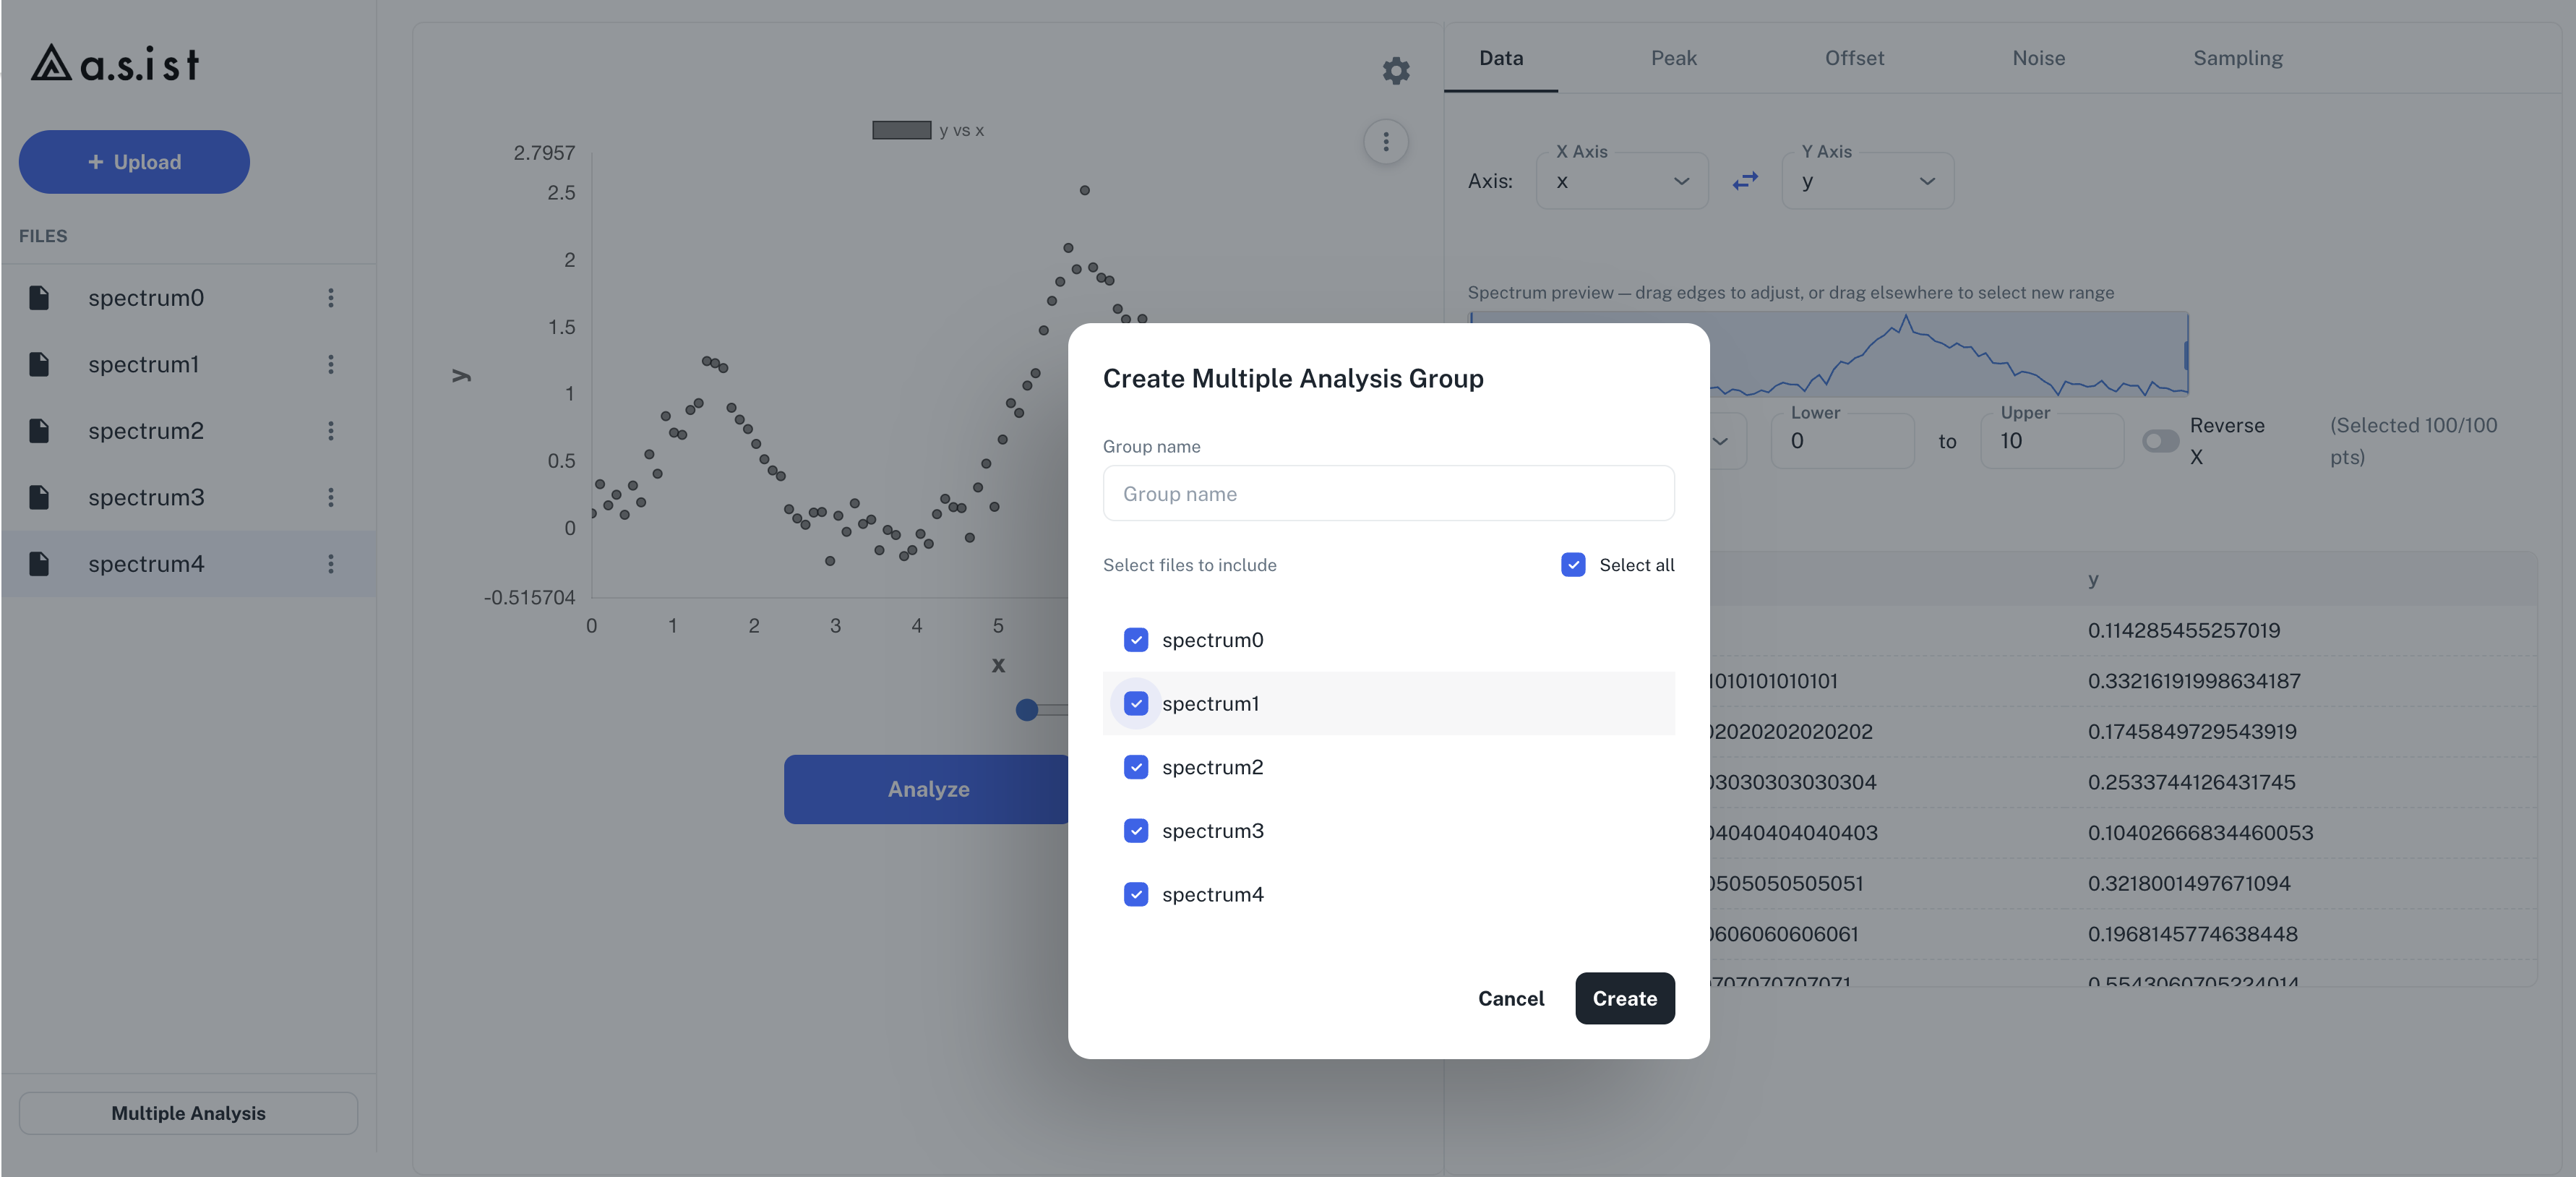
- Create: confirm with the Create button, and a group folder is created in the Files sidebar. Each selected spectrum is listed as a dataset under the group folder.
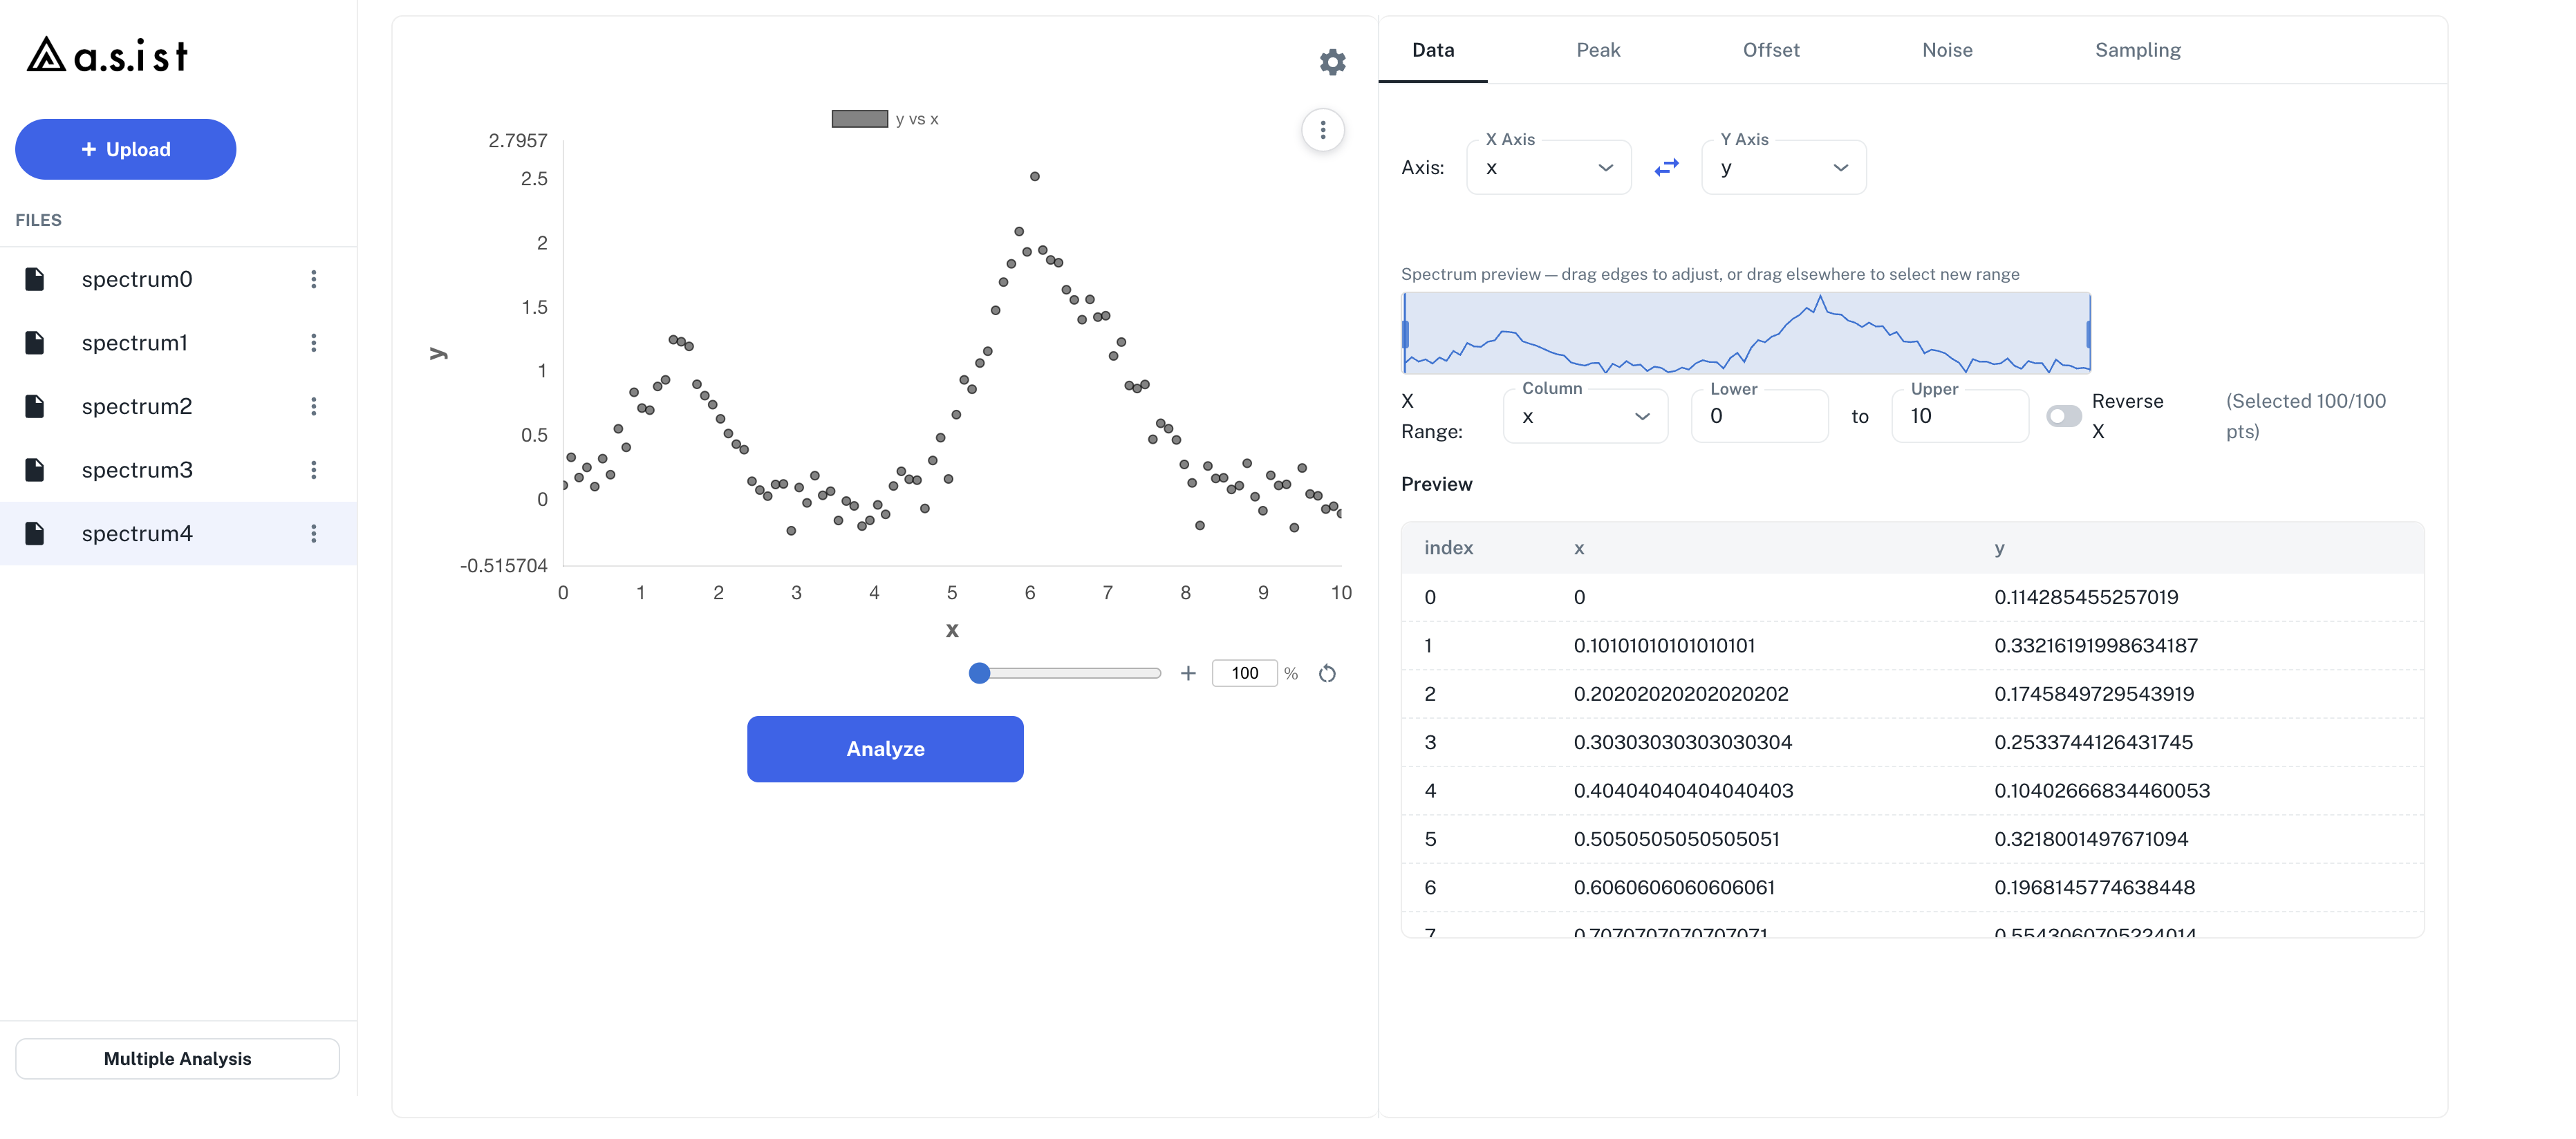
- Select a dataset to review its Data / Peak / Offset / Noise / Sampling settings
- Select the group folder to configure group analysis with Preview and Params Source
- See Chapter 9 for details on group analysis
4.4 Working with the Data Tab
After checking the spectrum in the center plot, configure the axes and the analysis range in the Data tab on the right.
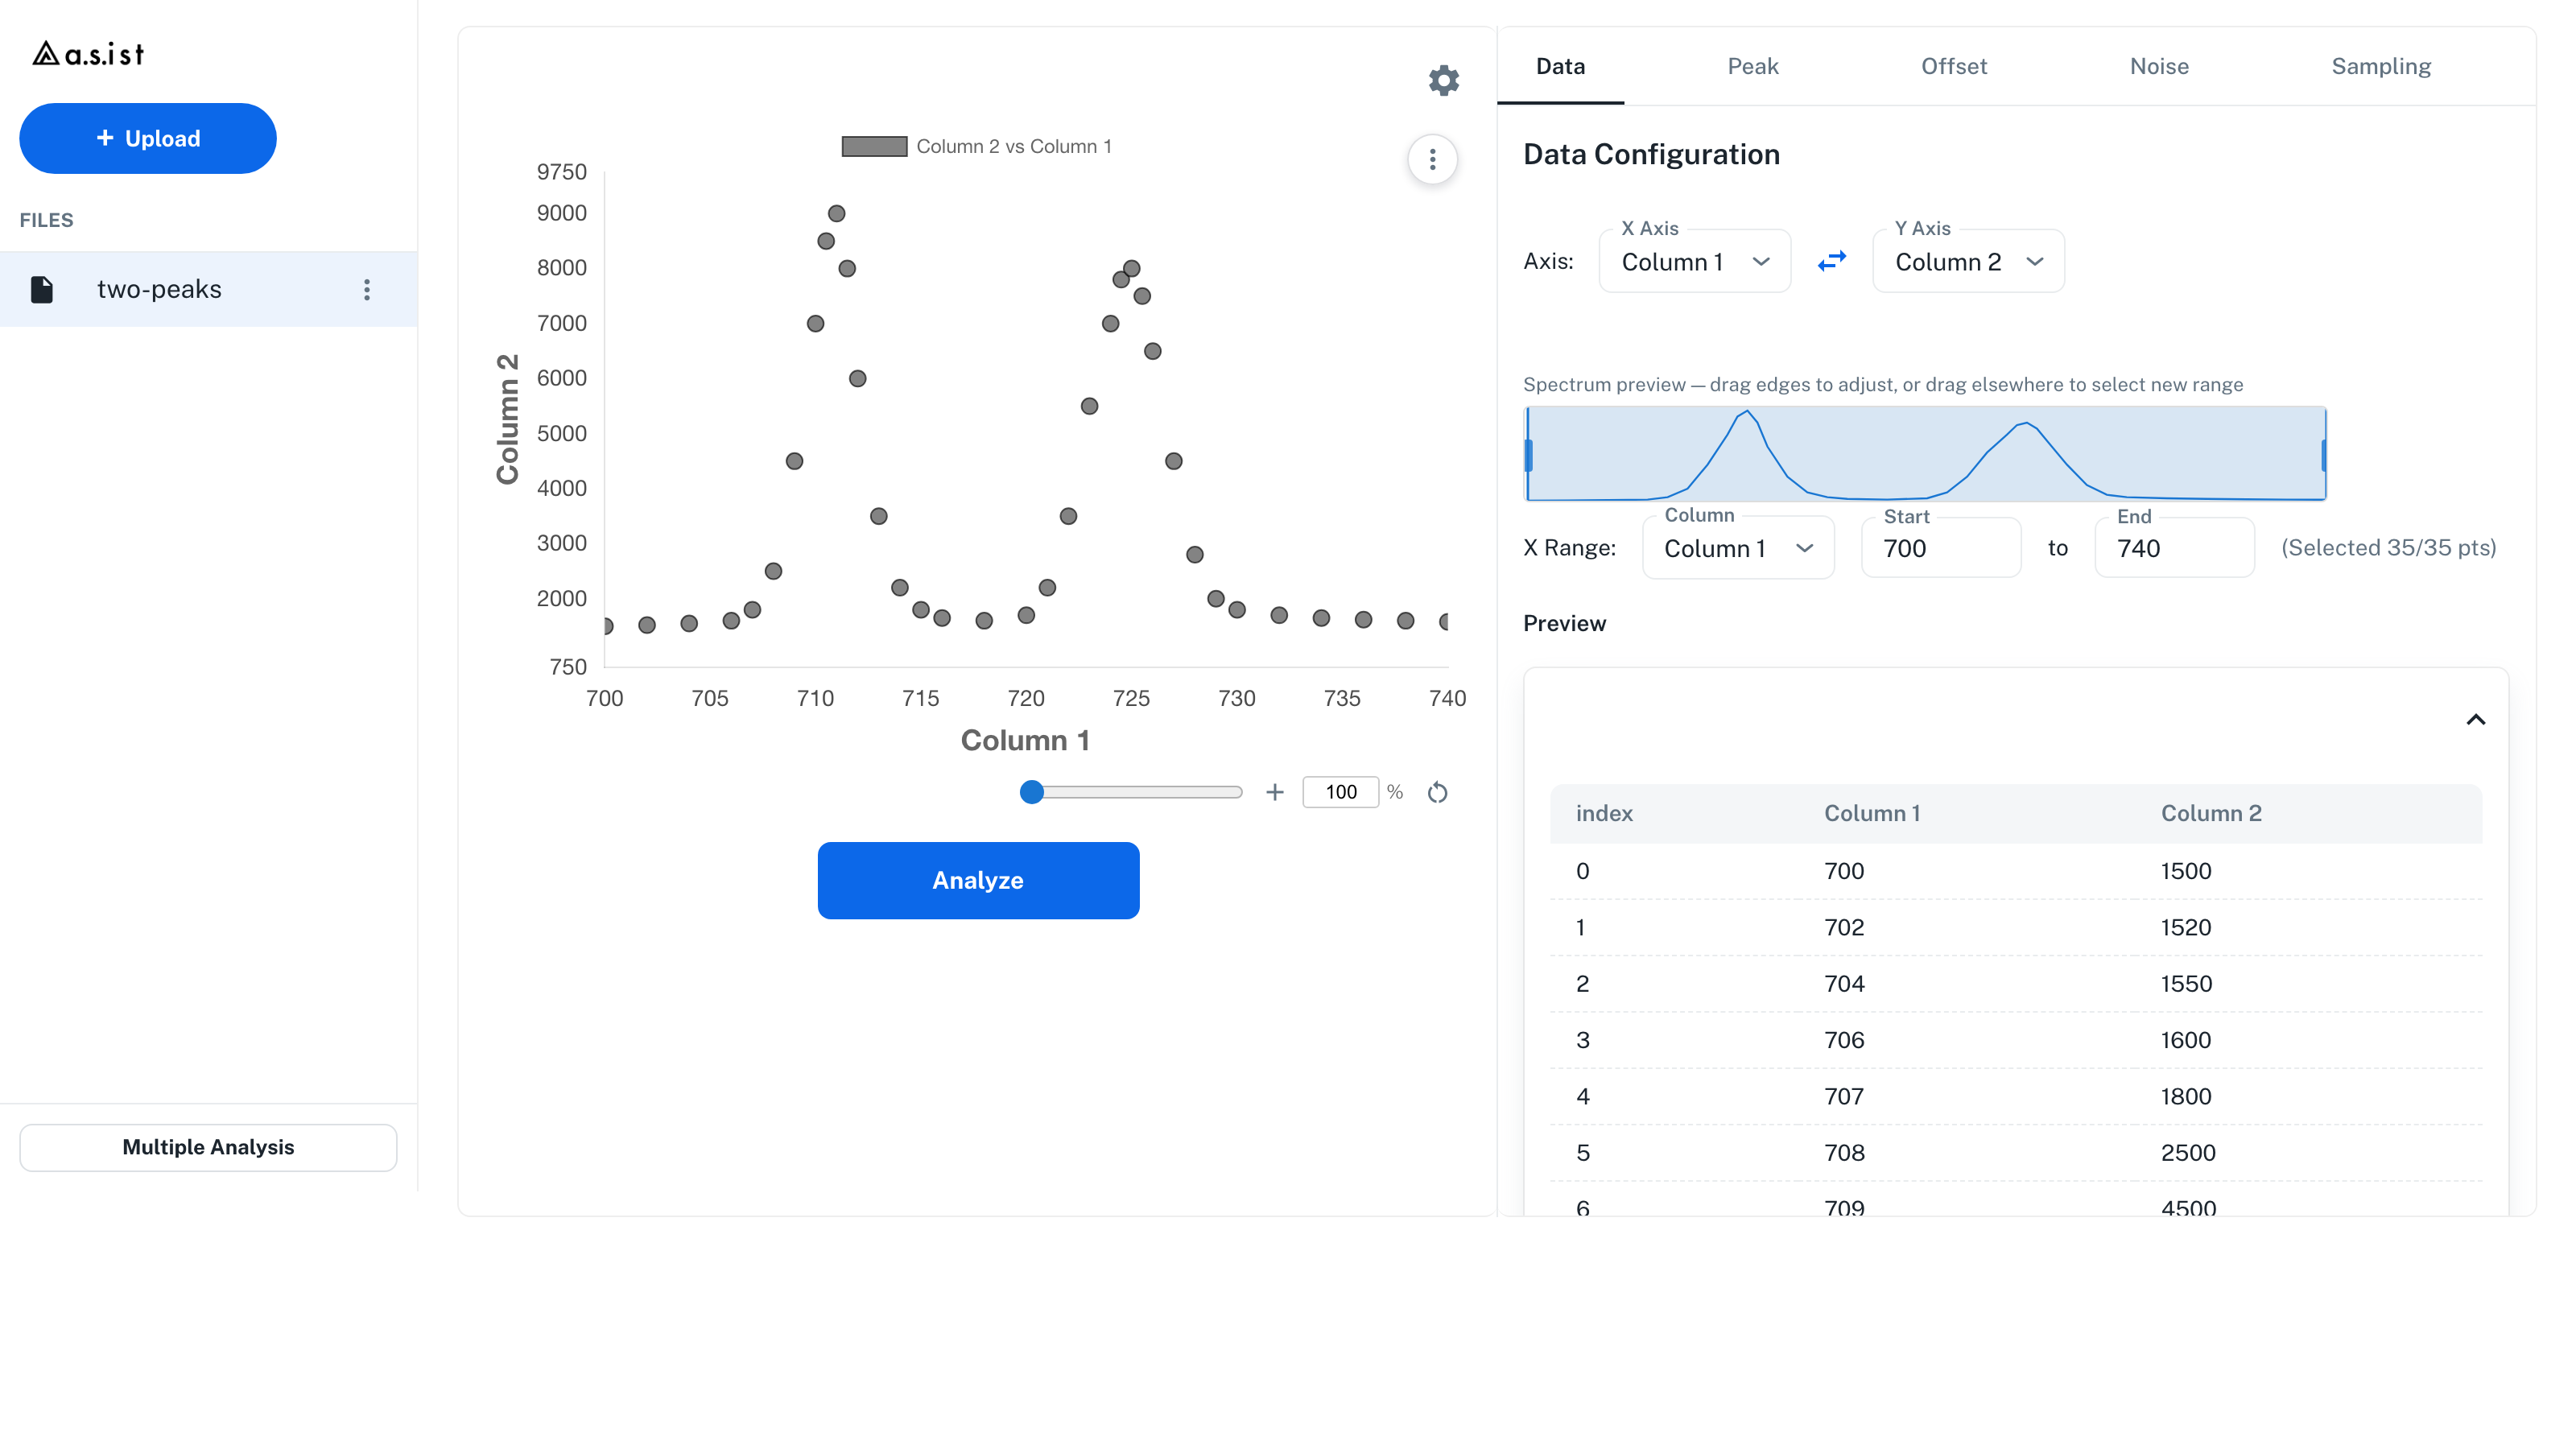
Axis selection
- X Axis: select the column that contains Binding Energy (usually the first column)
- Y Axis: select the column that contains Intensity (usually the second column)
Tip: You can swap the X and Y axes with the double-arrow icon in the Axis section.
Selecting the spectrum range
Drag on the spectrum preview bar to select the X range, or enter values directly into Lower / Upper.
- When you narrow the range, the
Selected N/M ptsindicator shows the number of points that will actually be analyzed - By default, the full range is selected
- The X Range applies to the column selected under X Axis above
Reversing the X-axis display
Use the Reverse X toggle in the X Range row to reverse the drawing direction of the X axis. When ON, values decrease from left to right (descending).
- If the column selected as the X Axis has a name containing
Binding Energy, the toggle turns ON automatically - For any other column, it turns OFF automatically. Switch it manually as needed
- The reversal only changes the display direction. The internal data order and the order in exported CSV files do not change
Y-axis display range
Use Y Range to set the Y-axis display range of the scatter plot.
- When Auto is ON, the Y-axis range is set automatically from the currently selected data range
- Turn Auto OFF to enter the desired Y-axis range in Min / Max
- Reset clears the manual input and returns to Auto
Y Range only controls the on-screen display range. The data points passed to the analysis are determined by the X Range and the selected X/Y Axis.
Data preview
The Preview section shows the number of rows and columns of the current data. To inspect the table, press Show preview. The preview is collapsed by default, and when opened it shows only the first rows for on-screen display. The analysis and export use all data in the selected range.